Numerical modeling of waves for a tsunami early warning system
Numerical modeling of waves for a tsunami early warning system
Numerical modeling of waves for a tsunami early warning system

Create successful ePaper yourself
Turn your PDF publications into a flip-book with our unique Google optimized e-Paper software.
<strong>Numerical</strong> <strong>modeling</strong> <strong>of</strong> <strong>waves</strong> <strong>for</strong> a <strong>tsunami</strong> <strong>early</strong> <strong>warning</strong> <strong>system</strong><br />
to be function <strong>of</strong> the wave frequency.<br />
aFourier<br />
aFourier<br />
1<br />
0.5<br />
Point A<br />
(a<br />
0<br />
0 0.5 1 1.5 2<br />
1<br />
0.5<br />
(c<br />
0<br />
0 0.5 1 1.5 2<br />
f (Hz)<br />
aFourier<br />
aFourier<br />
1<br />
0.5<br />
Point B<br />
(b<br />
0<br />
0 0.5 1 1.5 2<br />
1<br />
0.5<br />
(d<br />
0<br />
0 0.5 1 1.5 2<br />
f (Hz)<br />
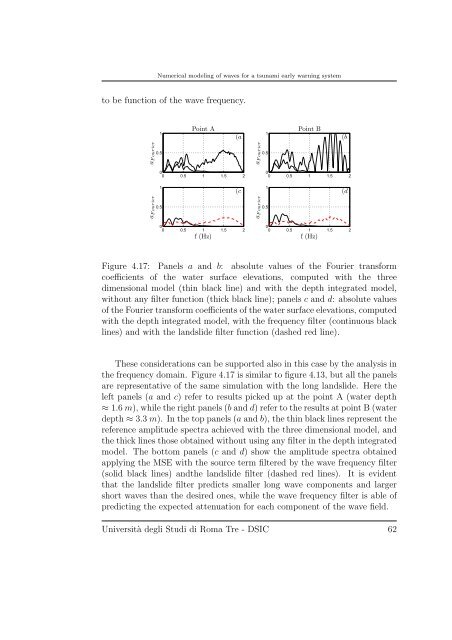
Figure 4.17: Panels a and b: absolute values <strong>of</strong> the Fourier trans<strong>for</strong>m<br />
coefficients <strong>of</strong> the water surface elevations, computed with the three<br />
dimensional model (thin black line) and with the depth integrated model,<br />
without any filter function (thick black line); panels c and d: absolute values<br />
<strong>of</strong> the Fourier trans<strong>for</strong>m coefficients <strong>of</strong> the water surface elevations, computed<br />
with the depth integrated model, with the frequency filter (continuous black<br />
lines) and with the landslide filter function (dashed red line).<br />
These considerations can be supported also in this case by the analysis in<br />
the frequency domain. Figure 4.17 is similar to figure 4.13, but all the panels<br />
are representative <strong>of</strong> the same simulation with the long landslide. Here the<br />
left panels (a and c) refer to results picked up at the point A (water depth<br />
≈ 1.6 m), while the right panels (b and d) refer to the results at point B (water<br />
depth ≈ 3.3 m). In the top panels (a and b), the thin black lines represent the<br />
reference amplitude spectra achieved with the three dimensional model, and<br />
the thick lines those obtained without using any filter in the depth integrated<br />
model. The bottom panels (c and d) show the amplitude spectra obtained<br />
applying the MSE with the source term filtered by the wave frequency filter<br />
(solid black lines) andthe landslide filter (dashed red lines). It is evident<br />
that the landslide filter predicts smaller long wave components and larger<br />
short <strong>waves</strong> than the desired ones, while the wave frequency filter is able <strong>of</strong><br />
predicting the expected attenuation <strong>for</strong> each component <strong>of</strong> the wave field.<br />
Università degli Studi di Roma Tre - DSIC 62