Numerical modeling of waves for a tsunami early warning system
Numerical modeling of waves for a tsunami early warning system
Numerical modeling of waves for a tsunami early warning system

You also want an ePaper? Increase the reach of your titles
YUMPU automatically turns print PDFs into web optimized ePapers that Google loves.
half an hour.<br />
ηS12(m)<br />
ηS7(m)<br />
ηS10(m)<br />
<strong>Numerical</strong> <strong>modeling</strong> <strong>of</strong> <strong>waves</strong> <strong>for</strong> a <strong>tsunami</strong> <strong>early</strong> <strong>warning</strong> <strong>system</strong><br />
0.02<br />
0.01<br />
0<br />
−0.01<br />
−0.02<br />
12 14 16 18 20 22<br />
0.02<br />
0.01<br />
0<br />
−0.01<br />
−0.02<br />
12 14 16 18 20 22<br />
0.02<br />
0.01<br />
0<br />
−0.01<br />
−0.02<br />
12 14 16 18 20 22<br />
t(s)<br />
ηS20(m)<br />
ηS11(m)<br />
0.02<br />
0.01<br />
0<br />
−0.01<br />
−0.02<br />
12 14 16 18 20 22<br />
0.02<br />
0.01<br />
0<br />
−0.01<br />
−0.02<br />
12 14 16 18 20 22<br />
t(s)<br />
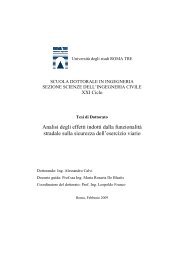
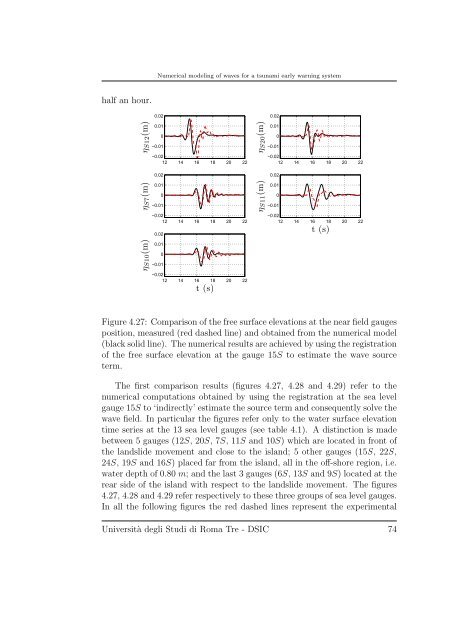
Figure 4.27: Comparison <strong>of</strong> the free surface elevations at the near field gauges<br />
position, measured (red dashed line) and obtained from the numerical model<br />
(black solid line). The numerical results are achieved by using the registration<br />
<strong>of</strong> the free surface elevation at the gauge 15S to estimate the wave source<br />
term.<br />
The first comparison results (figures 4.27, 4.28 and 4.29) refer to the<br />
numerical computations obtained by using the registration at the sea level<br />
gauge 15S to ‘indirectly’ estimate the source term and consequently solve the<br />
wave field. In particular the figures refer only to the water surface elevation<br />
time series at the 13 sea level gauges (see table 4.1). A distinction is made<br />
between 5 gauges (12S, 20S, 7S, 11S and 10S) which are located in front <strong>of</strong><br />
the landslide movement and close to the island; 5 other gauges (15S, 22S,<br />
24S, 19S and 16S) placed far from the island, all in the <strong>of</strong>f-shore region, i.e.<br />
water depth <strong>of</strong> 0.80 m; and the last 3 gauges (6S, 13S and 9S) located at the<br />
rear side <strong>of</strong> the island with respect to the landslide movement. The figures<br />
4.27, 4.28 and 4.29 refer respectively to these three groups <strong>of</strong> sea level gauges.<br />
In all the following figures the red dashed lines represent the experimental<br />
Università degli Studi di Roma Tre - DSIC 74