2009-10 Annual Report - Australia Post
2009-10 Annual Report - Australia Post
2009-10 Annual Report - Australia Post

Create successful ePaper yourself
Turn your PDF publications into a flip-book with our unique Google optimized e-Paper software.
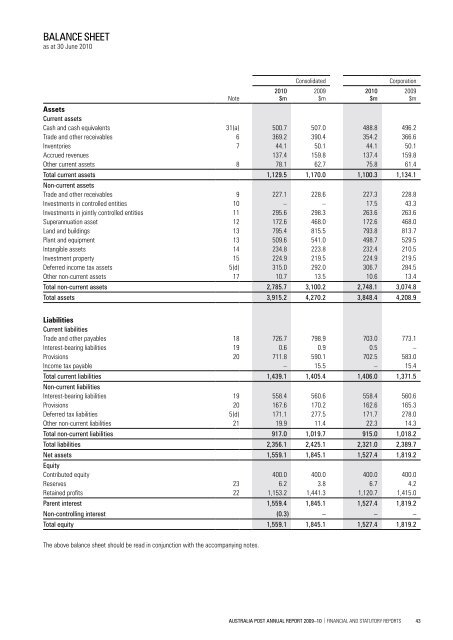
BAlAnCe sheet<br />
as at 30 June 20<strong>10</strong><br />
note<br />
20<strong>10</strong><br />
$m<br />
consolidated corporation<br />
Assets<br />
Current assets<br />
cash and cash equivalents<br />
31(a)<br />
500.7 507.0<br />
488.8 496.2<br />
trade and other receivables<br />
6<br />
369.2 390.4<br />
354.2 366.6<br />
inventories<br />
7<br />
44.1 50.1<br />
44.1 50.1<br />
accrued revenues<br />
137.4 159.8<br />
137.4 159.8<br />
other current assets<br />
8<br />
78.1 62.7<br />
75.8 61.4<br />
total current assets<br />
non-current assets<br />
1,129.5 1,170.0 1,<strong>10</strong>0.3 1,134.1<br />
trade and other receivables<br />
9<br />
227.1 228.6<br />
227.3 228.8<br />
investments in controlled entities<br />
<strong>10</strong><br />
–<br />
–<br />
17.5 43.3<br />
investments in jointly controlled entities<br />
11<br />
295.6 298.3<br />
263.6 263.6<br />
superannuation asset<br />
12<br />
172.6 468.0<br />
172.6 468.0<br />
land and buildings<br />
13<br />
795.4 815.5<br />
793.8 813.7<br />
plant and equipment<br />
13<br />
509.6 541.0<br />
498.7 529.5<br />
intangible assets<br />
14<br />
234.8 223.8<br />
232.4 2<strong>10</strong>.5<br />
investment property<br />
15<br />
224.9 219.5<br />
224.9 219.5<br />
deferred income tax assets<br />
5(d)<br />
315.0 292.0<br />
306.7 284.5<br />
other non-current assets<br />
17<br />
<strong>10</strong>.7 13.5<br />
<strong>10</strong>.6 13.4<br />
total non-current assets 2,785.7 3,<strong>10</strong>0.2 2,748.1 3,074.8<br />
total assets 3,915.2 4,270.2 3,848.4 4,208.9<br />
Liabilities<br />
Current liabilities<br />
trade and other payables<br />
interest-bearing liabilities<br />
provisions<br />
income tax payable<br />
total current liabilities 1,439.1 1,405.4 1,406.0 1,371.5<br />
non-current liabilities<br />
interest-bearing liabilities<br />
provisions<br />
deferred tax liabilities<br />
other non-current liabilities<br />
18<br />
19<br />
20<br />
19<br />
20<br />
5(d)<br />
21<br />
total non-current liabilities 917.0 1,019.7 915.0 1,018.2<br />
total liabilities 2,356.1 2,425.1 2,321.0 2,389.7<br />
net assets<br />
equity<br />
1,559.1 1,845.1 1,527.4 1,819.2<br />
contributed equity<br />
400.0 400.0<br />
400.0 400.0<br />
reserves<br />
23<br />
6.2 3.8<br />
6.7 4.2<br />
retained profits<br />
22 1,153.2 1,441.3<br />
1,120.7 1,415.0<br />
Parent interest 1,559.4 1,845.1 1,527.4 1,819.2<br />
non-controlling interest (0.3) – – –<br />
total equity 1,559.1 1,845.1 1,527.4 1,819.2<br />
the above balance sheet should be read in conjunction with the accompanying notes.<br />
726.7<br />
0.6<br />
711.8<br />
–<br />
558.4<br />
167.6<br />
171.1<br />
19.9<br />
<strong>2009</strong><br />
$m<br />
798.9<br />
0.9<br />
590.1<br />
15.5<br />
560.6<br />
170.2<br />
277.5<br />
11.4<br />
20<strong>10</strong><br />
$m<br />
703.0<br />
0.5<br />
702.5<br />
–<br />
558.4<br />
162.6<br />
171.7<br />
22.3<br />
<strong>2009</strong><br />
$m<br />
773.1<br />
–<br />
583.0<br />
15.4<br />
560.6<br />
165.3<br />
278.0<br />
14.3<br />
AustrAliA <strong>Post</strong> AnnuAl rePort <strong>2009</strong>–<strong>10</strong> | Financial and statutory reports 43