

Power Statistics - 2010 Edition - Full Report - Eurelectric
Power Statistics - 2010 Edition - Full Report - Eurelectric
Power Statistics - 2010 Edition - Full Report - Eurelectric

Create successful ePaper yourself
Turn your PDF publications into a flip-book with our unique Google optimized e-Paper software.
Supply 3.3 Electricity production<br />
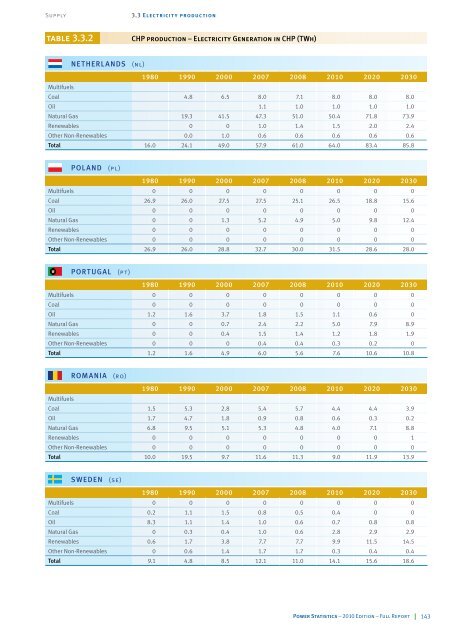
table 3.3.2 CHP production – Electricity Generation in CHP (TWh)<br />
NETHERLANDS (nl)<br />
1980 1990 2000 2007 2008 <strong>2010</strong> 2020 2030<br />
Multifuels<br />
Coal 4.8 6.5 8.0 7.1 8.0 8.0 8.0<br />
Oil 1.1 1.0 1.0 1.0 1.0<br />
Natural Gas 19.3 41.5 47.3 51.0 50.4 71.8 73.9<br />
Renewables 0 0 1.0 1.4 1.5 2.0 2.4<br />
Other Non-Renewables 0.0 1.0 0.6 0.6 0.6 0.6 0.6<br />
Total 16.0 24.1 49.0 57.9 61.0 64.0 83.4 85.8<br />
POLAND (pl)<br />
1980 1990 2000 2007 2008 <strong>2010</strong> 2020 2030<br />
Multifuels 0 0 0 0 0 0 0 0<br />
Coal 26.9 26.0 27.5 27.5 25.1 26.5 18.8 15.6<br />
Oil 0 0 0 0 0 0 0 0<br />
Natural Gas 0 0 1.3 5.2 4.9 5.0 9.8 12.4<br />
Renewables 0 0 0 0 0 0 0 0<br />
Other Non-Renewables 0 0 0 0 0 0 0 0<br />
Total 26.9 26.0 28.8 32.7 30.0 31.5 28.6 28.0<br />
PORTUGAL (pt)<br />
1980 1990 2000 2007 2008 <strong>2010</strong> 2020 2030<br />
Multifuels 0 0 0 0 0 0 0 0<br />
Coal 0 0 0 0 0 0 0 0<br />
Oil 1.2 1.6 3.7 1.8 1.5 1.1 0.6 0<br />
Natural Gas 0 0 0.7 2.4 2.2 5.0 7.9 8.9<br />
Renewables 0 0 0.4 1.5 1.4 1.2 1.8 1.9<br />
Other Non-Renewables 0 0 0 0.4 0.4 0.3 0.2 0<br />
Total 1.2 1.6 4.9 6.0 5.6 7.6 10.6 10.8<br />
ROMANIA (ro)<br />
1980 1990 2000 2007 2008 <strong>2010</strong> 2020 2030<br />
Multifuels<br />
Coal 1.5 5.3 2.8 5.4 5.7 4.4 4.4 3.9<br />
Oil 1.7 4.7 1.8 0.9 0.8 0.6 0.3 0.2<br />
Natural Gas 6.8 9.5 5.1 5.3 4.8 4.0 7.1 8.8<br />
Renewables 0 0 0 0 0 0 0 1<br />
Other Non-Renewables 0 0 0 0 0 0 0 0<br />
Total 10.0 19.5 9.7 11.6 11.3 9.0 11.9 13.9<br />
SWEDEN (se)<br />
1980 1990 2000 2007 2008 <strong>2010</strong> 2020 2030<br />
Multifuels 0 0 0 0 0 0 0 0<br />
Coal 0.2 1.1 1.5 0.8 0.5 0.4 0 0<br />
Oil 8.3 1.1 1.4 1.0 0.6 0.7 0.8 0.8<br />
Natural Gas 0 0.3 0.4 1.0 0.6 2.8 2.9 2.9<br />
Renewables 0.6 1.7 3.8 7.7 7.7 9.9 11.5 14.5<br />
Other Non-Renewables 0 0.6 1.4 1.7 1.7 0.3 0.4 0.4<br />
Total 9.1 4.8 8.5 12.1 11.0 14.1 15.6 18.6<br />
<strong>Power</strong> <strong>Statistics</strong> – <strong>2010</strong> <strong>Edition</strong> – <strong>Full</strong> <strong>Report</strong> 143


