

Power Statistics - 2010 Edition - Full Report - Eurelectric
Power Statistics - 2010 Edition - Full Report - Eurelectric
Power Statistics - 2010 Edition - Full Report - Eurelectric

Create successful ePaper yourself
Turn your PDF publications into a flip-book with our unique Google optimized e-Paper software.
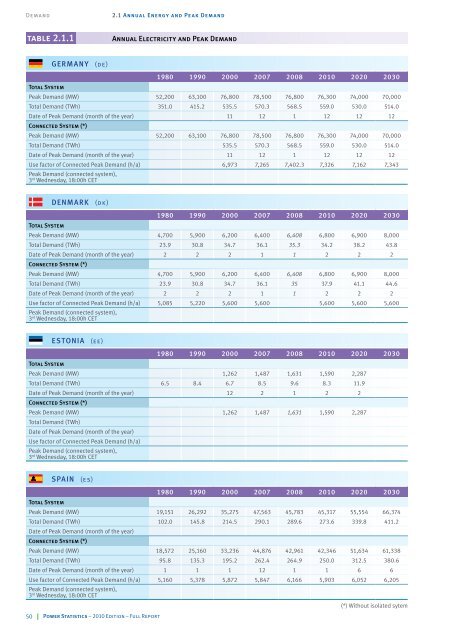
Demand 2.1 Annual Energy and Peak Demand<br />
table 2.1.1 Annual Electricity and Peak Demand<br />
GERMANy (de)<br />
50 <strong>Power</strong> <strong>Statistics</strong> – <strong>2010</strong> <strong>Edition</strong> – <strong>Full</strong> <strong>Report</strong><br />
1980 1990 2000 2007 2008 <strong>2010</strong> 2020 2030<br />
Total System<br />
Peak Demand (MW) 52,200 63,100 76,800 78,500 76,800 76,300 74,000 70,000<br />
Total Demand (TWh) 351.0 415.2 535.5 570.3 568.5 559.0 530.0 514.0<br />
Date of Peak Demand (month of the year)<br />
Connected System (*)<br />
11 12 1 12 12 12<br />
Peak Demand (MW) 52,200 63,100 76,800 78,500 76,800 76,300 74,000 70,000<br />
Total Demand (TWh) 535.5 570.3 568.5 559.0 530.0 514.0<br />
Date of Peak Demand (month of the year) 11 12 1 12 12 12<br />
Use factor of Connected Peak Demand (h/a)<br />
Peak Demand (connected system),<br />
3<br />
6,973 7,265 7,402.3 7,326 7,162 7,343<br />
rd Wednesday, 18:00h CET<br />
DENMARK (dk)<br />
1980 1990 2000 2007 2008 <strong>2010</strong> 2020 2030<br />
Total System<br />
Peak Demand (MW) 4,700 5,900 6,200 6,400 6,408 6,800 6,900 8,000<br />
Total Demand (TWh) 23.9 30.8 34.7 36.1 35.3 34.2 38.2 43.8<br />
Date of Peak Demand (month of the year)<br />
Connected System (*)<br />
2 2 2 1 1 2 2 2<br />
Peak Demand (MW) 4,700 5,900 6,200 6,400 6,408 6,800 6,900 8,000<br />
Total Demand (TWh) 23.9 30.8 34.7 36.1 35 37.9 41.1 44.6<br />
Date of Peak Demand (month of the year) 2 2 2 1 1 2 2 2<br />
Use factor of Connected Peak Demand (h/a)<br />
Peak Demand (connected system),<br />
3<br />
5,085 5,220 5,600 5,600 5,600 5,600 5,600<br />
rd Wednesday, 18:00h CET<br />
ESTONIA (ee)<br />
1980 1990 2000 2007 2008 <strong>2010</strong> 2020 2030<br />
Total System<br />
Peak Demand (MW) 1,262 1,487 1,631 1,590 2,287<br />
Total Demand (TWh) 6.5 8.4 6.7 8.5 9.6 8.3 11.9<br />
Date of Peak Demand (month of the year)<br />
Connected System (*)<br />
12 2 1 2 2<br />
Peak Demand (MW)<br />
Total Demand (TWh)<br />
Date of Peak Demand (month of the year)<br />
Use factor of Connected Peak Demand (h/a)<br />
Peak Demand (connected system),<br />
3<br />
1,262 1,487 1,631 1,590 2,287<br />
rd Wednesday, 18:00h CET<br />
SPAIN (es)<br />
1980 1990 2000 2007 2008 <strong>2010</strong> 2020 2030<br />
Total System<br />
Peak Demand (MW) 19,151 26,292 35,275 47,563 45,783 45,317 55,554 66,374<br />
Total Demand (TWh)<br />
Date of Peak Demand (month of the year)<br />
Connected System (*)<br />
102.0 145.8 214.5 290.1 289.6 273.6 339.8 411.2<br />
Peak Demand (MW) 18,572 25,160 33,236 44,876 42,961 42,346 51,634 61,338<br />
Total Demand (TWh) 95.8 135.3 195.2 262.4 264.9 250.0 312.5 380.6<br />
Date of Peak Demand (month of the year) 1 1 1 12 1 1 6 6<br />
Use factor of Connected Peak Demand (h/a)<br />
Peak Demand (connected system),<br />
3<br />
5,160 5,378 5,872 5,847 6,166 5,903 6,052 6,205<br />
rd Wednesday, 18:00h CET<br />
(*) Without isolated sytem


