

Power Statistics - 2010 Edition - Full Report - Eurelectric
Power Statistics - 2010 Edition - Full Report - Eurelectric
Power Statistics - 2010 Edition - Full Report - Eurelectric

Create successful ePaper yourself
Turn your PDF publications into a flip-book with our unique Google optimized e-Paper software.
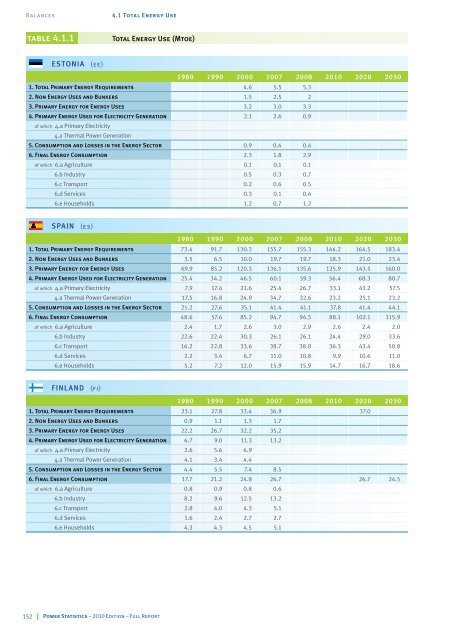
Balances 4.1 Total Energy Use<br />
table 4.1.1 Total Energy Use (Mtoe)<br />
ESTONIA (ee)<br />
152 <strong>Power</strong> <strong>Statistics</strong> – <strong>2010</strong> <strong>Edition</strong> – <strong>Full</strong> <strong>Report</strong><br />
1980 1990 2000 2007 2008 <strong>2010</strong> 2020 2030<br />
1. Total Primary Energy Requirements 4.6 5.5 5.3<br />
2. Non Energy Uses and Bunkers 1.5 2.5 2<br />
3. Primary Energy for Energy Uses 3.2 3.0 3.3<br />
4. Primary Energy Used for Electricity Generation 2.1 2.6 0.9<br />
of which 4.a Primary Electricity<br />
4.a Thermal <strong>Power</strong> Generation<br />
5. Consumption and Losses in the Energy Sector 0.9 0.4 0.4<br />
6. Final Energy Consumption 2.3 1.8 2.9<br />
of which 6.a Agriculture 0.1 0.1 0.1<br />
6.b Industry 0.5 0.3 0.7<br />
6.c Transport 0.2 0.6 0.5<br />
6.d Services 0.3 0.1 0.4<br />
6.e Households 1.2 0.7 1.2<br />
SPAIN (es)<br />
1980 1990 2000 2007 2008 <strong>2010</strong> 2020 2030<br />
1. Total Primary Energy Requirements 73.4 91.7 130.3 155.7 155.3 144.2 164.5 183.4<br />
2. Non Energy Uses and Bunkers 3.5 6.5 10.0 19.7 19.7 18.3 21.0 23.4<br />
3. Primary Energy for Energy Uses 69.9 85.2 120.3 136.1 135.6 125.9 143.5 160.0<br />
4. Primary Energy Used for Electricity Generation 25.4 34.2 46.5 60.1 59.3 56.4 68.3 80.7<br />
of which 4.a Primary Electricity 7.9 17.4 21.6 25.4 26.7 33.1 43.2 57.5<br />
4.a Thermal <strong>Power</strong> Generation 17.5 16.8 24.9 34.7 32.6 23.2 25.1 23.2<br />
5. Consumption and Losses in the Energy Sector 21.2 27.6 35.1 41.4 41.1 37.8 41.4 44.1<br />
6. Final Energy Consumption 48.6 57.6 85.2 94.7 94.5 88.1 102.1 115.9<br />
of which 6.a Agriculture 2.4 1.7 2.6 3.0 2.9 2.6 2.4 2.0<br />
6.b Industry 22.6 22.4 30.3 26.1 26.1 24.4 29.0 33.6<br />
6.c Transport 16.2 22.8 33.6 38.7 38.8 36.3 43.4 50.8<br />
6.d Services 2.2 3.4 6.7 11.0 10.8 9.9 10.6 11.0<br />
6.e Households 5.2 7.2 12.0 15.9 15.9 14.7 16.7 18.6<br />
FINLAND (fi)<br />
1980 1990 2000 2007 2008 <strong>2010</strong> 2020 2030<br />
1. Total Primary Energy Requirements 23.1 27.8 33.4 36.9 37.0<br />
2. Non Energy Uses and Bunkers 0.9 1.1 1.3 1.7<br />
3. Primary Energy for Energy Uses 22.2 26.7 32.2 35.2<br />
4. Primary Energy Used for Electricity Generation 6.7 9.0 11.3 13.2<br />
of which 4.a Primary Electricity 2.6 5.6 6.9<br />
4.a Thermal <strong>Power</strong> Generation 4.1 3.4 4.4<br />
5. Consumption and Losses in the Energy Sector 4.4 5.5 7.4 8.5<br />
6. Final Energy Consumption 17.7 21.2 24.8 26.7 26.7 24.5<br />
of which 6.a Agriculture 0.8 0.9 0.8 0.6<br />
6.b Industry 8.2 9.6 12.5 13.2<br />
6.c Transport 2.8 4.0 4.3 5.1<br />
6.d Services 1.6 2.4 2.7 2.7<br />
6.e Households 4.3 4.3 4.5 5.1


