

Power Statistics - 2010 Edition - Full Report - Eurelectric
Power Statistics - 2010 Edition - Full Report - Eurelectric
Power Statistics - 2010 Edition - Full Report - Eurelectric

Create successful ePaper yourself
Turn your PDF publications into a flip-book with our unique Google optimized e-Paper software.
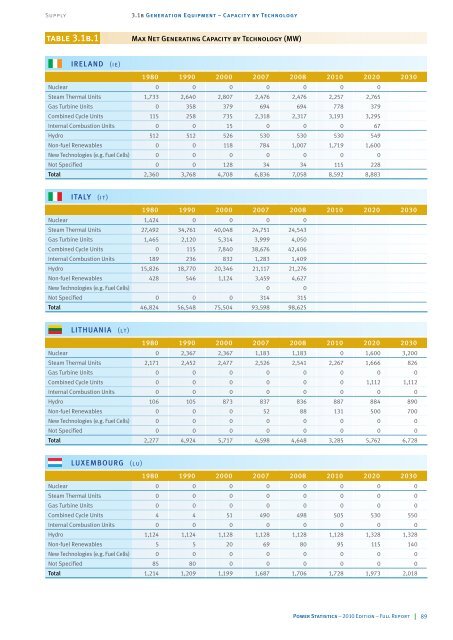
Supply 3.1b Generation Equipment – Capacity by Technology<br />
table 3.1b.1 Max Net Generating Capacity by Technology (MW)<br />
IRELAND (ie)<br />
1980 1990 2000 2007 2008 <strong>2010</strong> 2020 2030<br />
Nuclear 0 0 0 0 0 0 0<br />
Steam Thermal Units 1,733 2,640 2,807 2,476 2,476 2,257 2,765<br />
Gas Turbine Units 0 358 379 694 694 778 379<br />
Combined Cycle Units 115 258 735 2,318 2,317 3,193 3,295<br />
Internal Combustion Units 0 0 15 0 0 0 67<br />
Hydro 512 512 526 530 530 530 549<br />
Non-fuel Renewables 0 0 118 784 1,007 1,719 1,600<br />
New Technologies (e.g. Fuel Cells) 0 0 0 0 0 0 0<br />
Not Specified 0 0 128 34 34 115 228<br />
Total 2,360 3,768 4,708 6,836 7,058 8,592 8,883<br />
ITALy (it)<br />
1980 1990 2000 2007 2008 <strong>2010</strong> 2020 2030<br />
Nuclear 1,424 0 0 0 0<br />
Steam Thermal Units 27,492 34,761 40,048 24,751 24,543<br />
Gas Turbine Units 1,465 2,120 5,314 3,999 4,050<br />
Combined Cycle Units 0 115 7,840 38,676 42,406<br />
Internal Combustion Units 189 236 832 1,283 1,409<br />
Hydro 15,826 18,770 20,346 21,117 21,276<br />
Non-fuel Renewables 428 546 1,124 3,459 4,627<br />
New Technologies (e.g. Fuel Cells) 0 0<br />
Not Specified 0 0 0 314 315<br />
Total 46,824 56,548 75,504 93,598 98,625<br />
LITHUANIA (lt)<br />
1980 1990 2000 2007 2008 <strong>2010</strong> 2020 2030<br />
Nuclear 0 2,367 2,367 1,183 1,183 0 1,600 3,200<br />
Steam Thermal Units 2,171 2,452 2,477 2,526 2,541 2,267 1,666 826<br />
Gas Turbine Units 0 0 0 0 0 0 0 0<br />
Combined Cycle Units 0 0 0 0 0 0 1,112 1,112<br />
Internal Combustion Units 0 0 0 0 0 0 0 0<br />
Hydro 106 105 873 837 836 887 884 890<br />
Non-fuel Renewables 0 0 0 52 88 131 500 700<br />
New Technologies (e.g. Fuel Cells) 0 0 0 0 0 0 0 0<br />
Not Specified 0 0 0 0 0 0 0 0<br />
Total 2,277 4,924 5,717 4,598 4,648 3,285 5,762 6,728<br />
LUXEMBOURG (lu)<br />
1980 1990 2000 2007 2008 <strong>2010</strong> 2020 2030<br />
Nuclear 0 0 0 0 0 0 0 0<br />
Steam Thermal Units 0 0 0 0 0 0 0 0<br />
Gas Turbine Units 0 0 0 0 0 0 0 0<br />
Combined Cycle Units 4 4 51 490 498 505 530 550<br />
Internal Combustion Units 0 0 0 0 0 0 0 0<br />
Hydro 1,124 1,124 1,128 1,128 1,128 1,128 1,328 1,328<br />
Non-fuel Renewables 5 5 20 69 80 95 115 140<br />
New Technologies (e.g. Fuel Cells) 0 0 0 0 0 0 0 0<br />
Not Specified 85 80 0 0 0 0 0 0<br />
Total 1,214 1,209 1,199 1,687 1,706 1,728 1,973 2,018<br />
<strong>Power</strong> <strong>Statistics</strong> – <strong>2010</strong> <strong>Edition</strong> – <strong>Full</strong> <strong>Report</strong> 89


