Power Statistics - 2010 Edition - Full Report - Eurelectric
Power Statistics - 2010 Edition - Full Report - Eurelectric
Power Statistics - 2010 Edition - Full Report - Eurelectric
Create successful ePaper yourself
Turn your PDF publications into a flip-book with our unique Google optimized e-Paper software.
Electricity <strong>Statistics</strong><br />
Demand Trends<br />
Electricity demand increases,<br />
driven by heating and transport<br />
Over a period of nearly three decades, from 1980 to 2008,<br />
electricity demand increased by more than 70 % (see Figure 1<br />
above). While the economic crisis led to a reduction in demand<br />
of about 4.2 %, the shift towards electrification, as well as the<br />
recovery of electricity demand from industry and services,<br />
means growth will resume before 2020.<br />
All sectors – agriculture, industry, transport, services,<br />
as well as households – are expected to increase their<br />
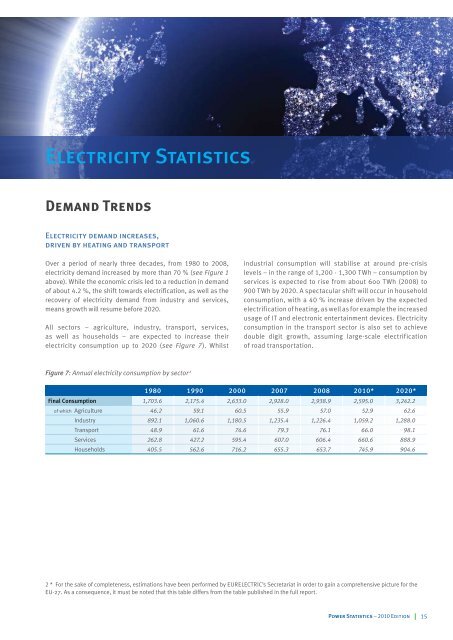
electricity consumption up to 2020 (see Figure 7). Whilst<br />
Figure 7: Annual electricity consumption by sector 2<br />
industrial consumption will stabilise at around pre-crisis<br />
levels – in the range of 1,200 - 1,300 TWh – consumption by<br />
services is expected to rise from about 600 TWh (2008) to<br />
900 TWh by 2020. A spectacular shift will occur in household<br />
consumption, with a 40 % increase driven by the expected<br />
electrif ication of heating, as well as for example the increased<br />
usage of IT and electronic entertainment devices. Electricity<br />
consumption in the transport sector is also set to achieve<br />
double digit growth, assuming large-scale electrification<br />
of road transportation.<br />
1980 1990 2000 2007 2008 <strong>2010</strong>* 2020*<br />
Final Consumption 1,703.6 2,175.4 2,633.0 2,928.0 2,938.9 2,595.0 3,242.2<br />
of which Agriculture 46.2 59.1 60.5 55.9 57.0 52.9 62.6<br />
Industry 892.1 1,060.6 1,180.5 1,235.4 1,226.4 1,059.2 1,288.0<br />
Transport 48.9 61.6 74.6 79.3 76.1 66.0 98.1<br />
Services 262.8 427.2 595.4 607.0 606.4 660.6 888.9<br />
Households 405.5 562.6 716.2 655.3 653.7 745.9 904.6<br />
2 * For the sake of completeness, estimations have been performed by EURELECTRIC’s Secretariat in order to gain a comprehensive picture for the<br />
EU-27. As a consequence, it must be noted that this table differs from the table published in the full report.<br />
<strong>Power</strong> <strong>Statistics</strong> – <strong>2010</strong> <strong>Edition</strong> 15


