

Power Statistics - 2010 Edition - Full Report - Eurelectric
Power Statistics - 2010 Edition - Full Report - Eurelectric
Power Statistics - 2010 Edition - Full Report - Eurelectric

Create successful ePaper yourself
Turn your PDF publications into a flip-book with our unique Google optimized e-Paper software.
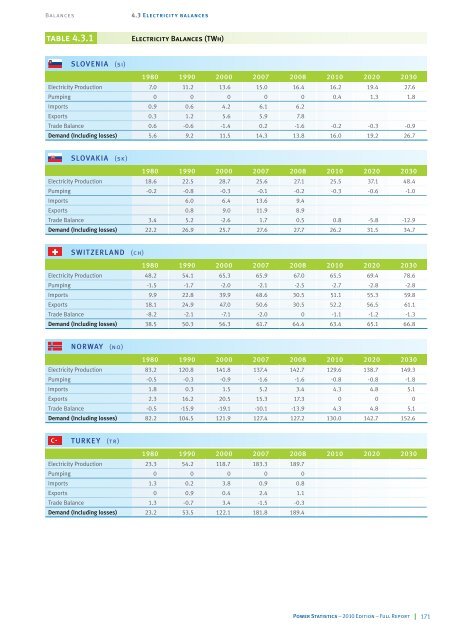
Balances 4.3 Electricity balances<br />
table 4.3.1 Electricity Balances (TWh)<br />
SLOVENIA (si)<br />
1980 1990 2000 2007 2008 <strong>2010</strong> 2020 2030<br />
Electricity Production 7.0 11.2 13.6 15.0 16.4 16.2 19.4 27.6<br />
Pumping 0 0 0 0 0 0.4 1.3 1.8<br />
Imports 0.9 0.6 4.2 6.1 6.2<br />
Exports 0.3 1.2 5.6 5.9 7.8<br />
Trade Balance 0.6 -0.6 -1.4 0.2 -1.6 -0.2 -0.3 -0.9<br />
Demand (Including losses) 5.6 9.2 11.5 14.3 13.8 16.0 19.2 26.7<br />
SLOVAKIA (sk)<br />
1980 1990 2000 2007 2008 <strong>2010</strong> 2020 2030<br />
Electricity Production 18.6 22.5 28.7 25.6 27.1 25.5 37.1 48.4<br />
Pumping -0.2 -0.8 -0.3 -0.1 -0.2 -0.3 -0.6 -1.0<br />
Imports 6.0 6.4 13.6 9.4<br />
Exports 0.8 9.0 11.9 8.9<br />
Trade Balance 3.4 5.2 -2.6 1.7 0.5 0.8 -5.8 -12.9<br />
Demand (Including losses) 22.2 26.9 25.7 27.6 27.7 26.2 31.5 34.7<br />
SWITZERLAND (ch)<br />
1980 1990 2000 2007 2008 <strong>2010</strong> 2020 2030<br />
Electricity Production 48.2 54.1 65.3 65.9 67.0 65.5 69.4 78.6<br />
Pumping -1.5 -1.7 -2.0 -2.1 -2.5 -2.7 -2.8 -2.8<br />
Imports 9.9 22.8 39.9 48.6 30.5 51.1 55.3 59.8<br />
Exports 18.1 24.9 47.0 50.6 30.5 52.2 56.5 61.1<br />
Trade Balance -8.2 -2.1 -7.1 -2.0 0 -1.1 -1.2 -1.3<br />
Demand (Including losses) 38.5 50.3 56.3 61.7 64.4 63.4 65.1 66.8<br />
NORWAy (no)<br />
1980 1990 2000 2007 2008 <strong>2010</strong> 2020 2030<br />
Electricity Production 83.2 120.8 141.8 137.4 142.7 129.6 138.7 149.3<br />
Pumping -0.5 -0.3 -0.9 -1.6 -1.6 -0.8 -0.8 -1.8<br />
Imports 1.8 0.3 1.5 5.2 3.4 4.3 4.8 5.1<br />
Exports 2.3 16.2 20.5 15.3 17.3 0 0 0<br />
Trade Balance -0.5 -15.9 -19.1 -10.1 -13.9 4.3 4.8 5.1<br />
Demand (Including losses) 82.2 104.5 121.9 127.4 127.2 130.0 142.7 152.6<br />
TURKEy (tr)<br />
1980 1990 2000 2007 2008 <strong>2010</strong> 2020 2030<br />
Electricity Production 23.3 54.2 118.7 183.3 189.7<br />
Pumping 0 0 0 0 0<br />
Imports 1.3 0.2 3.8 0.9 0.8<br />
Exports 0 0.9 0.4 2.4 1.1<br />
Trade Balance 1.3 -0.7 3.4 -1.5 -0.3<br />
Demand (Including losses) 23.2 53.5 122.1 181.8 189.4<br />
<strong>Power</strong> <strong>Statistics</strong> – <strong>2010</strong> <strong>Edition</strong> – <strong>Full</strong> <strong>Report</strong> 171


