

Power Statistics - 2010 Edition - Full Report - Eurelectric
Power Statistics - 2010 Edition - Full Report - Eurelectric
Power Statistics - 2010 Edition - Full Report - Eurelectric

Create successful ePaper yourself
Turn your PDF publications into a flip-book with our unique Google optimized e-Paper software.
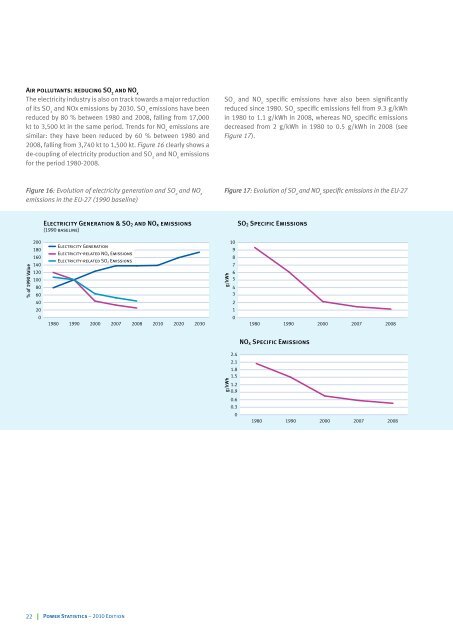
Air pollutants: reducing SO 2 and NO x<br />
The electricity industry is also on track towards a major reduction<br />
of its SO 2 and NOx emissions by 2030. SO 2 emissions have been<br />
reduced by 80 % between 1980 and 2008, falling from 17,000<br />
kt to 3,500 kt in the same period. Trends for NO x emissions are<br />
similar: they have been reduced by 60 % between 1980 and<br />
2008, falling from 3,740 kt to 1,500 kt. Figure 16 clearly shows a<br />
de-coupling of electricity production and SO 2 and NO x emissions<br />
for the period 1980-2008.<br />
Figure 16: Evolution of electricity generation and SO 2 and NO x<br />
emissions in the EU-27 (1990 baseline)<br />
% of 1990 Value<br />
200<br />
180<br />
160<br />
140<br />
120<br />
100<br />
80<br />
60<br />
40<br />
20<br />
0<br />
Electricity Generation & SO2 and NOx emissions<br />
(1990 baseline)<br />
Electricity Generation<br />
Electricity-related NOx Emissions<br />
Electricity-related SO2 Emissions<br />
1980 1990 2000 2007 2008 <strong>2010</strong> 2020 2030<br />
22 <strong>Power</strong> <strong>Statistics</strong> – <strong>2010</strong> <strong>Edition</strong><br />
SO 2 and NO x specific emissions have also been significantly<br />
reduced since 1980. SO 2 specific emissions fell from 9.3 g/kWh<br />
in 1980 to 1.1 g/kWh in 2008, whereas NO x specific emissions<br />
decreased from 2 g/kWh in 1980 to 0.5 g/kWh in 2008 (see<br />
Figure 17).<br />
Figure 17: Evolution of SO 2 and NO x specific emissions in the EU-27<br />
g/kWh<br />
g/kWh<br />
10<br />
9<br />
8<br />
7<br />
6<br />
5<br />
4<br />
3<br />
2<br />
1<br />
0<br />
2.4<br />
2.1<br />
1.8<br />
1.5<br />
1.2<br />
0.9<br />
0.6<br />
0.3<br />
0<br />
SO2 Specific Emissions<br />
1980 1990 2000 2007 2008<br />
NOx Specific Emissions<br />
1980 1990 2000 2007 2008


