

Power Statistics - 2010 Edition - Full Report - Eurelectric
Power Statistics - 2010 Edition - Full Report - Eurelectric
Power Statistics - 2010 Edition - Full Report - Eurelectric

You also want an ePaper? Increase the reach of your titles
YUMPU automatically turns print PDFs into web optimized ePapers that Google loves.
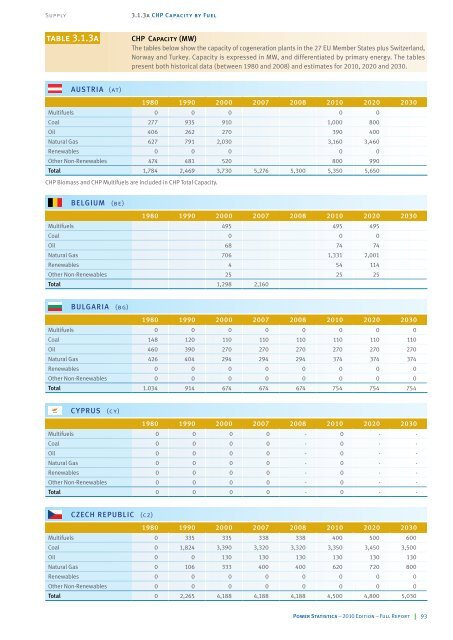
Supply 3.1.3a CHP Capacity by Fuel<br />
table 3.1.3a CHP Capacity (MW)<br />
The tables below show the capacity of cogeneration plants in the 27 EU Member States plus Switzerland,<br />
Norway and Turkey. Capacity is expressed in MW, and differentiated by primary energy. The tables<br />
present both historical data (between 1980 and 2008) and estimates for <strong>2010</strong>, 2020 and 2030.<br />
AUSTRIA (at)<br />
1980 1990 2000 2007 2008 <strong>2010</strong> 2020 2030<br />
Multifuels 0 0 0 0 0<br />
Coal 277 935 910 1,000 800<br />
Oil 406 262 270 390 400<br />
Natural Gas 627 791 2,030 3,160 3,460<br />
Renewables 0 0 0 0 0<br />
Other Non-Renewables 474 481 520 800 990<br />
Total 1,784 2,469 3,730 5,276 5,300 5,350 5,650<br />
CHP Biomass and CHP Multifuels are included in CHP Total Capacity.<br />
BELGIUM (be)<br />
1980 1990 2000 2007 2008 <strong>2010</strong> 2020 2030<br />
Multifuels 495 495 495<br />
Coal 0 0 0<br />
Oil 68 74 74<br />
Natural Gas 706 1,331 2,001<br />
Renewables 4 54 114<br />
Other Non-Renewables 25 25 25<br />
Total 1,298 2,160<br />
BULGARIA (bg)<br />
1980 1990 2000 2007 2008 <strong>2010</strong> 2020 2030<br />
Multifuels 0 0 0 0 0 0 0 0<br />
Coal 148 120 110 110 110 110 110 110<br />
Oil 460 390 270 270 270 270 270 270<br />
Natural Gas 426 404 294 294 294 374 374 374<br />
Renewables 0 0 0 0 0 0 0 0<br />
Other Non-Renewables 0 0 0 0 0 0 0 0<br />
Total 1.034 914 674 674 674 754 754 754<br />
CyPRUS (cy)<br />
1980 1990 2000 2007 2008 <strong>2010</strong> 2020 2030<br />
Multifuels 0 0 0 0 - 0 - -<br />
Coal 0 0 0 0 - 0 - -<br />
Oil 0 0 0 0 - 0 - -<br />
Natural Gas 0 0 0 0 - 0 - -<br />
Renewables 0 0 0 0 - 0 - -<br />
Other Non-Renewables 0 0 0 0 - 0 - -<br />
Total 0 0 0 0 - 0 - -<br />
CZECH REPUBLIC (cz)<br />
1980 1990 2000 2007 2008 <strong>2010</strong> 2020 2030<br />
Multifuels 0 335 335 338 338 400 500 600<br />
Coal 0 1,824 3,390 3,320 3,320 3,350 3,450 3,500<br />
Oil 0 0 130 130 130 130 130 130<br />
Natural Gas 0 106 333 400 400 620 720 800<br />
Renewables 0 0 0 0 0 0 0 0<br />
Other Non-Renewables 0 0 0 0 0 0 0 0<br />
Total 0 2,265 4,188 4,188 4,188 4,500 4,800 5,030<br />
<strong>Power</strong> <strong>Statistics</strong> – <strong>2010</strong> <strong>Edition</strong> – <strong>Full</strong> <strong>Report</strong> 93


