

Power Statistics - 2010 Edition - Full Report - Eurelectric
Power Statistics - 2010 Edition - Full Report - Eurelectric
Power Statistics - 2010 Edition - Full Report - Eurelectric

Create successful ePaper yourself
Turn your PDF publications into a flip-book with our unique Google optimized e-Paper software.
174 <strong>Power</strong> <strong>Statistics</strong> – <strong>2010</strong> <strong>Edition</strong> – <strong>Full</strong> <strong>Report</strong><br />
Environment<br />
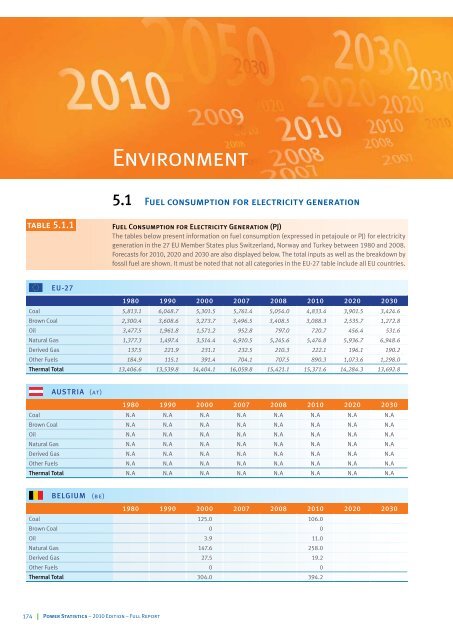
5.1 Fuel consumption for electricity generation<br />
table 5.1.1 Fuel Consumption for Electricity Generation (PJ)<br />
The tables below present information on fuel consumption (expressed in petajoule or PJ) for electricity<br />
generation in the 27 EU Member States plus Switzerland, Norway and Turkey between 1980 and 2008.<br />
Forecasts for <strong>2010</strong>, 2020 and 2030 are also displayed below. The total inputs as well as the breakdown by<br />
fossil fuel are shown. It must be noted that not all categories in the EU-27 table include all EU countries.<br />
EU-27<br />
1980 1990 2000 2007 2008 <strong>2010</strong> 2020 2030<br />
Coal 5,813.1 6,048.7 5,301.5 5,761.4 5,054.0 4,833.4 3,901.5 3,424.6<br />
Brown Coal 2,300.4 3,608.6 3,273.7 3,496.5 3,408.5 3,088.3 2,535.7 1,272.8<br />
Oil 3,477.5 1,961.8 1,571.2 952.8 797.0 720.7 456.4 531.6<br />
Natural Gas 1,377.3 1,497.4 3,514.4 4,910.5 5,245.6 5,474.8 5,936.7 6,948.6<br />
Derived Gas 137.5 221.9 231.1 232.5 210.3 222.1 196.1 190.2<br />
Other Fuels 184.9 115.1 391.4 704.1 707.5 890.3 1,073.6 1,298.0<br />
Thermal Total 13,406.6 13,539.8 14,404.1 16,059.8 15,421.1 15,371.6 14,284.3 13,692.8<br />
AUSTRIA (at)<br />
1980 1990 2000 2007 2008 <strong>2010</strong> 2020 2030<br />
Coal N.A N.A N.A N.A N.A N.A N.A N.A<br />
Brown Coal N.A N.A N.A N.A N.A N.A N.A N.A<br />
Oil N.A N.A N.A N.A N.A N.A N.A N.A<br />
Natural Gas N.A N.A N.A N.A N.A N.A N.A N.A<br />
Derived Gas N.A N.A N.A N.A N.A N.A N.A N.A<br />
Other Fuels N.A N.A N.A N.A N.A N.A N.A N.A<br />
Thermal Total N.A N.A N.A N.A N.A N.A N.A N.A<br />
BELGIUM (be)<br />
1980 1990 2000 2007 2008 <strong>2010</strong> 2020 2030<br />
Coal 125.0 106.0<br />
Brown Coal 0 0<br />
Oil 3.9 11.0<br />
Natural Gas 147.6 258.0<br />
Derived Gas 27.5 19.2<br />
Other Fuels 0 0<br />
Thermal Total 304.0 394.2


