

Power Statistics - 2010 Edition - Full Report - Eurelectric
Power Statistics - 2010 Edition - Full Report - Eurelectric
Power Statistics - 2010 Edition - Full Report - Eurelectric

Create successful ePaper yourself
Turn your PDF publications into a flip-book with our unique Google optimized e-Paper software.
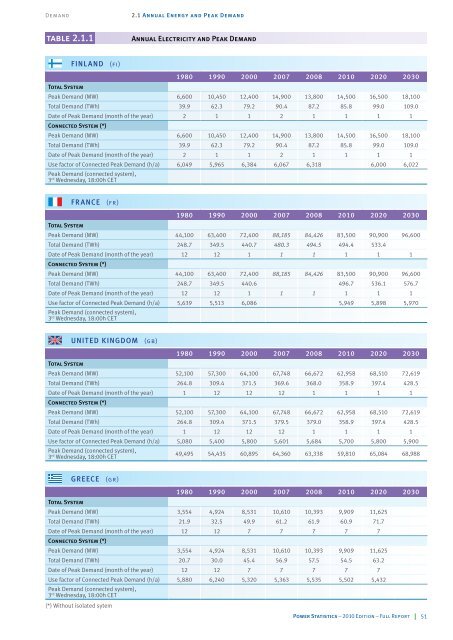
Demand 2.1 Annual Energy and Peak Demand<br />
table 2.1.1 Annual Electricity and Peak Demand<br />
FINLAND (fi)<br />
1980 1990 2000 2007 2008 <strong>2010</strong> 2020 2030<br />
Total System<br />
Peak Demand (MW) 6,600 10,450 12,400 14,900 13,800 14,500 16,500 18,100<br />
Total Demand (TWh) 39.9 62.3 79.2 90.4 87.2 85.8 99.0 109.0<br />
Date of Peak Demand (month of the year)<br />
Connected System (*)<br />
2 1 1 2 1 1 1 1<br />
Peak Demand (MW) 6,600 10,450 12,400 14,900 13,800 14,500 16,500 18,100<br />
Total Demand (TWh) 39.9 62.3 79.2 90.4 87.2 85.8 99.0 109.0<br />
Date of Peak Demand (month of the year) 2 1 1 2 1 1 1 1<br />
Use factor of Connected Peak Demand (h/a)<br />
Peak Demand (connected system),<br />
3<br />
6,049 5,965 6,384 6,067 6,318 6,000 6,022<br />
rd Wednesday, 18:00h CET<br />
FRANCE (fr)<br />
1980 1990 2000 2007 2008 <strong>2010</strong> 2020 2030<br />
Total System<br />
Peak Demand (MW) 44,100 63,400 72,400 88,185 84,426 83,500 90,900 96,600<br />
Total Demand (TWh) 248.7 349.5 440.7 480.3 494.5 494.4 533.4<br />
Date of Peak Demand (month of the year)<br />
Connected System (*)<br />
12 12 1 1 1 1 1 1<br />
Peak Demand (MW) 44,100 63,400 72,400 88,185 84,426 83,500 90,900 96,600<br />
Total Demand (TWh) 248.7 349.5 440.6 496.7 536.1 576.7<br />
Date of Peak Demand (month of the year) 12 12 1 1 1 1 1 1<br />
Use factor of Connected Peak Demand (h/a)<br />
Peak Demand (connected system),<br />
3<br />
5,639 5,513 6,086 5,949 5,898 5,970<br />
rd Wednesday, 18:00h CET<br />
UNITED KINGDOM (gb)<br />
1980 1990 2000 2007 2008 <strong>2010</strong> 2020 2030<br />
Total System<br />
Peak Demand (MW) 52,100 57,300 64,100 67,748 66,672 62,958 68,510 72,619<br />
Total Demand (TWh) 264.8 309.4 371.5 369.6 368.0 358.9 397.4 428.5<br />
Date of Peak Demand (month of the year)<br />
Connected System (*)<br />
1 12 12 12 1 1 1 1<br />
Peak Demand (MW) 52,100 57,300 64,100 67,748 66,672 62,958 68,510 72,619<br />
Total Demand (TWh) 264.8 309.4 371.5 379.5 379.0 358.9 397.4 428.5<br />
Date of Peak Demand (month of the year) 1 12 12 12 1 1 1 1<br />
Use factor of Connected Peak Demand (h/a) 5,080 5,400 5,800 5,601 5,684 5,700 5,800 5,900<br />
Peak Demand (connected system),<br />
3rd Wednesday, 18:00h CET<br />
49,495 54,435 60,895 64,360 63,338 59,810 65,084 68,988<br />
GREECE (gr)<br />
1980 1990 2000 2007 2008 <strong>2010</strong> 2020 2030<br />
Total System<br />
Peak Demand (MW) 3,554 4,924 8,531 10,610 10,393 9,909 11,625<br />
Total Demand (TWh) 21.9 32.5 49.9 61.2 61.9 60.9 71.7<br />
Date of Peak Demand (month of the year)<br />
Connected System (*)<br />
12 12 7 7 7 7 7<br />
Peak Demand (MW) 3,554 4,924 8,531 10,610 10,393 9,909 11,625<br />
Total Demand (TWh) 20.7 30.0 45.4 56.9 57.5 54.5 63.2<br />
Date of Peak Demand (month of the year) 12 12 7 7 7 7 7<br />
Use factor of Connected Peak Demand (h/a)<br />
Peak Demand (connected system),<br />
3<br />
5,880 6,240 5,320 5,363 5,535 5,502 5,432<br />
rd Wednesday, 18:00h CET<br />
(*) Without isolated sytem<br />
<strong>Power</strong> <strong>Statistics</strong> – <strong>2010</strong> <strong>Edition</strong> – <strong>Full</strong> <strong>Report</strong> 51


