

Power Statistics - 2010 Edition - Full Report - Eurelectric
Power Statistics - 2010 Edition - Full Report - Eurelectric
Power Statistics - 2010 Edition - Full Report - Eurelectric

Create successful ePaper yourself
Turn your PDF publications into a flip-book with our unique Google optimized e-Paper software.
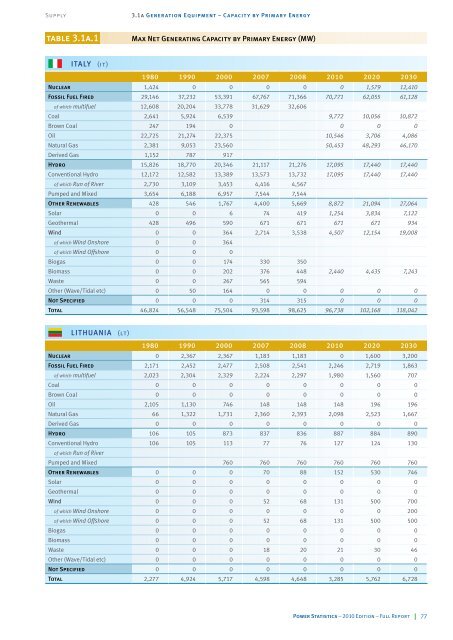
Supply 3.1a Generation Equipment – Capacity by Primary Energy<br />
table 3.1a.1 Max Net Generating Capacity by Primary Energy (MW)<br />
ITALy (it)<br />
1980 1990 2000 2007 2008 <strong>2010</strong> 2020 2030<br />
Nuclear 1,424 0 0 0 0 0 1,579 12,410<br />
Fossil Fuel Fired 29,146 37,232 53,391 67,767 71,366 70,771 62,055 61,128<br />
of which multifuel 12,608 20,204 33,778 31,629 32,606<br />
Coal 2,641 5,924 6,539 9,772 10,056 10,872<br />
Brown Coal 247 194 0 0 0 0<br />
Oil 22,725 21,274 22,375 10,546 3,706 4,086<br />
Natural Gas 2,381 9,053 23,560 50,453 48,293 46,170<br />
Derived Gas 1,152 787 917<br />
Hydro 15,826 18,770 20,346 21,117 21,276 17,095 17,440 17,440<br />
Conventional Hydro 12,172 12,582 13,389 13,573 13,732 17,095 17,440 17,440<br />
of which Run of River 2,730 3,109 3,453 4,416 4,567<br />
Pumped and Mixed 3,654 6,188 6,957 7,544 7,544<br />
Other Renewables 428 546 1,767 4,400 5,669 8,872 21,094 27,064<br />
Solar 0 0 6 74 419 1,254 3,834 7,122<br />
Geothermal 428 496 590 671 671 671 671 934<br />
Wind 0 0 364 2,714 3,538 4,507 12,154 19,008<br />
of which Wind Onshore 0 0 364<br />
of which Wind Offshore 0 0 0<br />
Biogas 0 0 174 330 350<br />
Biomass 0 0 202 376 448 2,440 4,435 7,243<br />
Waste 0 0 267 565 594<br />
Other (Wave/Tidal etc) 0 50 164 0 0 0 0 0<br />
Not Specified 0 0 0 314 315 0 0 0<br />
Total 46,824 56,548 75,504 93,598 98,625 96,738 102,168 118,042<br />
LITHUANIA (lt)<br />
1980 1990 2000 2007 2008 <strong>2010</strong> 2020 2030<br />
Nuclear 0 2,367 2,367 1,183 1,183 0 1,600 3,200<br />
Fossil Fuel Fired 2,171 2,452 2,477 2,508 2,541 2,246 2,719 1,863<br />
of which multifuel 2,023 2,304 2,329 2,224 2,297 1,980 1,560 707<br />
Coal 0 0 0 0 0 0 0 0<br />
Brown Coal 0 0 0 0 0 0 0 0<br />
Oil 2,105 1,130 746 148 148 148 196 196<br />
Natural Gas 66 1,322 1,731 2,360 2,393 2,098 2,523 1,667<br />
Derived Gas 0 0 0 0 0 0 0 0<br />
Hydro 106 105 873 837 836 887 884 890<br />
Conventional Hydro 106 105 113 77 76 127 124 130<br />
of which Run of River<br />
Pumped and Mixed 760 760 760 760 760 760<br />
Other Renewables 0 0 0 70 88 152 530 746<br />
Solar 0 0 0 0 0 0 0 0<br />
Geothermal 0 0 0 0 0 0 0 0<br />
Wind 0 0 0 52 68 131 500 700<br />
of which Wind Onshore 0 0 0 0 0 0 0 200<br />
of which Wind Offshore 0 0 0 52 68 131 500 500<br />
Biogas 0 0 0 0 0 0 0 0<br />
Biomass 0 0 0 0 0 0 0 0<br />
Waste 0 0 0 18 20 21 30 46<br />
Other (Wave/Tidal etc) 0 0 0 0 0 0 0 0<br />
Not Specified 0 0 0 0 0 0 0 0<br />
Total 2,277 4,924 5,717 4,598 4,648 3,285 5,762 6,728<br />
<strong>Power</strong> <strong>Statistics</strong> – <strong>2010</strong> <strong>Edition</strong> – <strong>Full</strong> <strong>Report</strong> 77


