Z<strong>on</strong>e Member State Maize type 2010 2009 2008 2007 2006 2005 2004 2003 2002 2001 Silage 1,944.2 1,933.1 1,903.5 1,888.9 1,850.6 1,857.3 1,923.1 2,130.6 1,939.1 2,008.4 All 4 978.6 5,487.2 5,704.1 5,343.2 5,438.7 5,702.3 6,192.8 6,260.5 6,016.8 6,264.8 European Uni<strong>on</strong> 27 Gra<strong>in</strong> 7,780.5 8,362.8 8,855.6 8,061.8 8,511.8 8,953.3 10,110.3 9,786.6 9,360.3 9,595.7 Silage 5,241.3 5,304.8 5,182.6 5,007.6 4,762.9 4,667.8 4,703.9 4,793.4 4,490.4 4,542.2 All 13,021.8 13,667.6 14,038,2 13,069,4 13,274.7 13,621.1 14,814.2 14,580.0 13,850.7 14,137.9 -: figure not available 1 : 2005 figure from <strong>the</strong> Swedish Board of Agriculture; http://www.jordbruksverket.se/swedishboardofagriculture/statistics 2 : from FAOStat; http://faostat.fao.org and Statbel; http://statbel.fgov.be 3 : from Statbel 4 : from UKAgriculture; http://www.ukagriculture.com/statistics/farm<strong>in</strong>g_statistics.cfm 5 : from FAOStat Table 3: Structure of farms with gra<strong>in</strong> maize <strong>in</strong> 2007 (Source: Eurostat) Z<strong>on</strong>e Member State Number of hold<strong>in</strong>gs with an area of gra<strong>in</strong> maize of: 0-0.5 ha 0.5-1 ha 1-2 ha 2-5 ha 5-10 ha 10-20 ha 20-50 ha >50 ha Denmark - - - - - - - - Est<strong>on</strong>ia - - - - - - - - A North F<strong>in</strong>land - - - - - - - - Latvia - - - - - - - - Lithuania 50 50 30 60 50 40 30 30 Sweden - - - - - - - - Austria 1,820 2,530 4,480 7,300 5,860 4,330 1,730 170 Belgium 150 350 1,090 2,740 2,210 1,270 450 40 B Centre Czech Republic 210 50 90 200 140 190 280 520 Germany 1,040 1,600 4,090 9,730 7,860 6,080 4,030 1,040 Hungary 106,300 21,650 25,350 22,130 9,290 6,140 4,360 3,340 Luxembourg - 0 10 10 10 10 0 - <strong>the</strong> Ne<strong>the</strong>rlands 40 90 320 1,020 980 630 200 20 Page 10 of 64
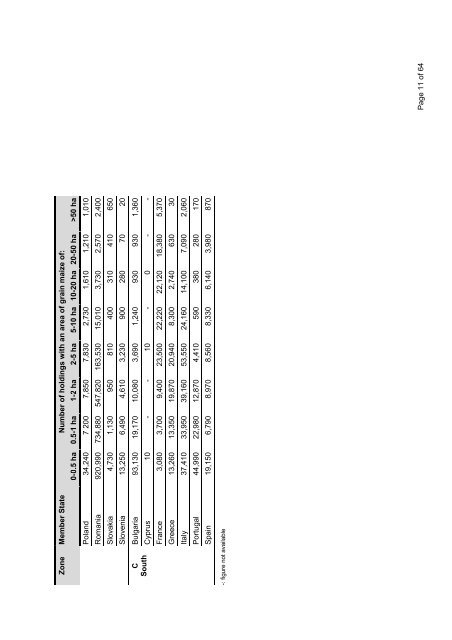
Z<strong>on</strong>e Member State Number of hold<strong>in</strong>gs with an area of gra<strong>in</strong> maize of: 0-0.5 ha 0.5-1 ha 1-2 ha 2-5 ha 5-10 ha 10-20 ha 20-50 ha >50 ha Poland 34,240 7 200 7,850 7,830 2,730 1,610 1,210 1,010 Romania 920,990 734,880 547,820 163,530 15,010 3,730 2,570 2,400 Slovakia 4,730 1,130 950 810 400 310 410 650 Slovenia 13,250 6,490 4,610 3,230 900 280 70 20 Bulgaria 93,130 19,170 10,080 3,690 1,240 930 930 1,360 Cyprus 10 - - 10 - 0 - - C South France 3,080 3,700 9,400 23,500 22,220 22,120 18,380 5,370 Greece 13,260 13,350 19,870 20,940 8,300 2,740 630 30 Italy 37,410 33,950 39,160 53,550 24,160 14,100 7,090 2,060 Portugal 44,990 22,980 12,870 4,410 590 380 280 170 Spa<strong>in</strong> 19,150 6,790 8,970 8,560 8,330 6,140 3,980 870 -: figure not available Page 11 of 64