Finance for Small and Medium-Sized Enterprises - DTI Home Page
Finance for Small and Medium-Sized Enterprises - DTI Home Page
Finance for Small and Medium-Sized Enterprises - DTI Home Page

Create successful ePaper yourself
Turn your PDF publications into a flip-book with our unique Google optimized e-Paper software.
<strong>Finance</strong> <strong>for</strong> <strong>Small</strong> <strong>and</strong> <strong>Medium</strong>-<strong>Sized</strong> <strong>Enterprises</strong>: A Report on the 2004 UK Survey of SME <strong>Finance</strong>s<br />
Ethnic minority businesses<br />
The distribution of businesses which are 50% or more (‘majority’) owned by<br />
individuals<br />
from white <strong>and</strong> ethnic minority groups respectively, are reported in the<br />
following pie chart.<br />
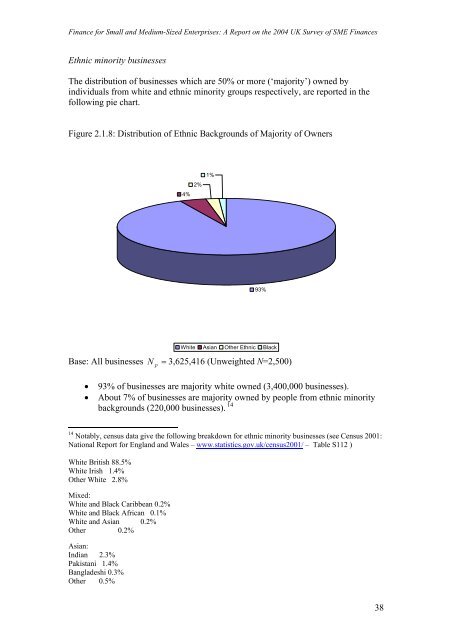
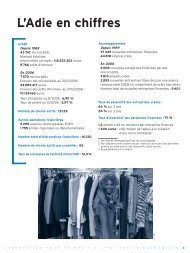
Figure 2.1.8: Distribution of Ethnic Backgrounds<br />
of Majority of Owners<br />
Base: All businesses N p =<br />
4%<br />
2%<br />
1%<br />
93%<br />
White Asian Other Ethnic Black<br />
3,625,416 (Unweighted N=2,500)<br />
usinesses are m y white o 3,400,000 esses).<br />
of businesses ajority ow by people f thnic minority<br />
220,000 b sinesses). 14<br />
• 93% of b<br />
ajorit wned ( busin<br />
• About 7%<br />
are m ned rom<br />
e<br />
backgrounds ( u<br />
14<br />
Notably, census data give the following bre akdown <strong>for</strong> ethnic minority businesses (see Census 2001:<br />
National Report <strong>for</strong> Engl<strong>and</strong> <strong>and</strong> Wale s – www.statistics.gov.uk/census2001/ – Table S112 )<br />
White British 88.5%<br />
White Irish 1.4%<br />
Other White 2.8%<br />
Mixed:<br />
White<br />
<strong>and</strong> Black Caribbean 0.2%<br />
White<br />
<strong>and</strong> Black African 0.1%<br />
White <strong>and</strong> Asian 0.2%<br />
Other 0.2%<br />
Asian:<br />
Indian 2.3%<br />
Pakistani 1.4%<br />
Bangladeshi 0.3%<br />
Other 0.5%<br />
38


![Joint Report on Social Protection and Social Inclusion [2005]](https://img.yumpu.com/19580638/1/190x132/joint-report-on-social-protection-and-social-inclusion-2005.jpg?quality=85)