Annual Report 2010 - Falck
Annual Report 2010 - Falck
Annual Report 2010 - Falck

You also want an ePaper? Increase the reach of your titles
YUMPU automatically turns print PDFs into web optimized ePapers that Google loves.
28 <strong>Falck</strong> <strong>Annual</strong> <strong>Report</strong> <strong>2010</strong> | Management review<br />
Financial review<br />
<strong>Falck</strong>’s revenue grew by 11.1% in <strong>2010</strong> to DKK 8,367 million of<br />
which organic growth accounted for 5.1%. The revenue growth<br />
and organic growth met Management’s expectations. The<br />
percentage of Group revenue generated outside Denmark rose<br />
to 36.7% (2009: 34.6%), as the growth rate for markets outside<br />
Denmark was 18.2%, of which organic growth accounted for<br />
6.7%. The rate of organic growth in Denmark was 4.2%.<br />
Operating profit before costs and amortisation from businees<br />
combinations and exceptional items (EBITA) was DKK 839 million<br />
(2009: DKK 721 million) and was on a level with Management’s<br />
quidance. This brought EBITA growth to 16.3%, which<br />
met Management’s expectations as the EBITA margin increased<br />
to 10.0%. This was attributable to growth in the Emergency,<br />
Healthcare and Training business areas. The Assistance business<br />
experienced a substantial adverse impact from the long periods<br />
of severe winter weather in January/February and November/<br />
December, resulting in a major increase in the number of<br />
responses.<br />
Profit for the year rose by 9.8% to DKK 458 million (2009: DKK<br />
417 million).<br />
<strong>Falck</strong> generated a free cash flow of DKK 842 million in <strong>2010</strong><br />
(2009: DKK 1,096 million), representing a cash conversion rate<br />
of 100.4% (2009: 152.0%) in terms of conversion of EBITA into<br />
cash.<br />
The ratio of net debt to EBITDA dropped from 2.64x in 2009<br />
to 2.48x in <strong>2010</strong>, which was attributable to the increase in<br />
earnings and the cash flow generated.<br />
Change in accounting policies<br />
A number of new financial reporting standards and interpretations<br />
have been implemented with effect for the financial year<br />
<strong>2010</strong>.<br />
With the exception of the implementation of IFRS 3 Business<br />
Combinations, and IAS 27 Consolidated and Separate Financial<br />
Statements, the implementation of these financial reporting<br />
standards, improvements and interpretations has not affected<br />
recognition and measurement in <strong>2010</strong>. The effect of IFRS 3 and<br />
IAS 27 was a reduction of profit for the year by DKK 22 million,<br />
a reduction of equity and the balance sheet (goodwill) by DKK<br />
49 million and diluted earnings per share by DKK 0.2.<br />
See note 1 to the consolidated financial statements for a<br />
complete overview of new financial reporting standards and<br />
interpretations implemented with effect for the financial year<br />
<strong>2010</strong>.<br />
Basis of presentation<br />
The financial review is based on the financial highlights and key<br />
ratios on page 6 and cannot be derived directly from the consolidated<br />
financial statements.<br />
Group performance in <strong>2010</strong><br />
Consolidated income statement<br />
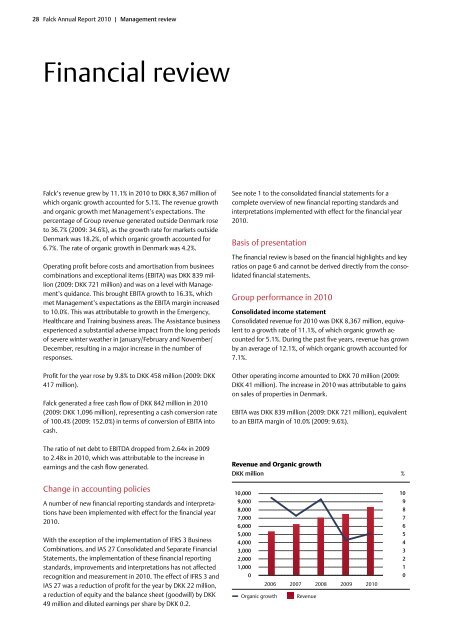
Consolidated revenue for <strong>2010</strong> was DKK 8,367 million, equivalent<br />
to a growth rate of 11.1%, of which organic growth accounted<br />
for 5.1%. During the past five years, revenue has grown<br />
by an average of 12.1%, of which organic growth accounted for<br />
7.1%.<br />
Other operating income amounted to DKK 70 million (2009:<br />
DKK 41 million). The increase in <strong>2010</strong> was attributable to gains<br />
on sales of properties in Denmark.<br />
EBITA was DKK 839 million (2009: DKK 721 million), equivalent<br />
to an EBITA margin of 10.0% (2009: 9.6%).<br />
Revenue and Organic growth<br />
DKK million %<br />
10,000<br />
9,000<br />
8,000<br />
7,000<br />
6,000<br />
5,000<br />
4,000<br />
3,000<br />
2,000<br />
1,000<br />
0<br />
2006 2007 2008 2009 <strong>2010</strong><br />
Organic growth Revenue<br />
10<br />
9<br />
8<br />
7<br />
6<br />
5<br />
4<br />
3<br />
2<br />
1<br />
0