Annual Report 2010 - Falck
Annual Report 2010 - Falck
Annual Report 2010 - Falck

You also want an ePaper? Increase the reach of your titles
YUMPU automatically turns print PDFs into web optimized ePapers that Google loves.
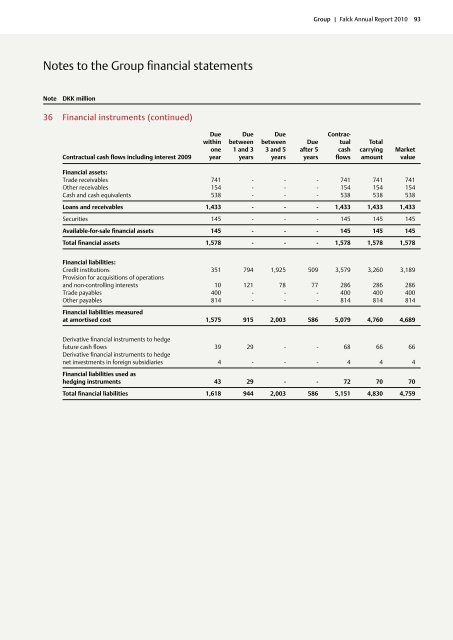
Notes to the Group financial statements<br />
Note DKK million<br />
36 Financial instruments (continued)<br />
Group | <strong>Falck</strong> <strong>Annual</strong> <strong>Report</strong> <strong>2010</strong> 93<br />
Due Due Due Contrac-<br />
within between between Due tual Total<br />
one 1 and 3 3 and 5 after 5 cash carrying market<br />
Contractual cash flows including interest 2009 year years years years flows amount value<br />
Financial assets:<br />
Trade receivables 741 - - - 741 741 741<br />
Other receivables 154 - - - 154 154 154<br />
Cash and cash equivalents 538 - - - 538 538 538<br />
Loans and receivables 1,433 - - - 1,433 1,433 1,433<br />
Securities 145 - - - 145 145 145<br />
Available-for-sale financial assets 145 - - - 145 145 145<br />
Total financial assets 1,578 - - - 1,578 1,578 1,578<br />
Financial liabilities:<br />
Credit institutions 351 794 1,925 509 3,579 3,260 3,189<br />
Provision for acquisitions of operations<br />
and non-controlling interests 10 121 78 77 286 286 286<br />
Trade payables 400 - - - 400 400 400<br />
Other payables 814 - - - 814 814 814<br />
Financial liabilities measured<br />
at amortised cost 1,575 915 2,003 586 5,079 4,760 4,689<br />
Derivative financial instruments to hedge<br />
future cash flows 39 29 - - 68 66 66<br />
Derivative financial instruments to hedge<br />
net investments in foreign subsidiaries 4 - - - 4 4 4<br />
Financial liabilities used as<br />
hedging instruments 43 29 - - 72 70 70<br />
Total financial liabilities 1,618 944 2,003 586 5,151 4,830 4,759