Macroalgae and phytoplankton as indicators of ... - Naturstyrelsen
Macroalgae and phytoplankton as indicators of ... - Naturstyrelsen
Macroalgae and phytoplankton as indicators of ... - Naturstyrelsen

Create successful ePaper yourself
Turn your PDF publications into a flip-book with our unique Google optimized e-Paper software.
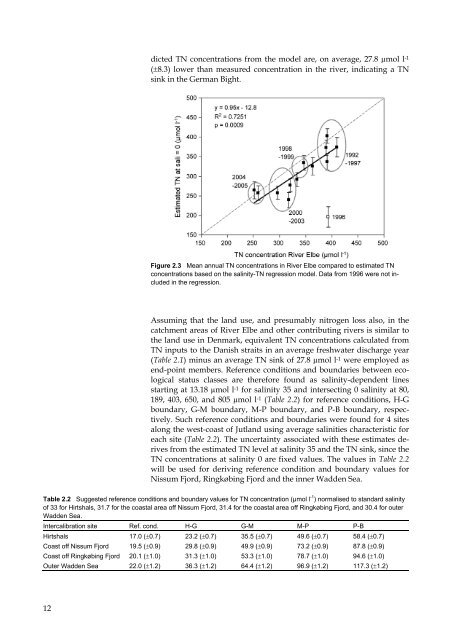
dicted TN concentrations from the model are, on average, 27.8 µmol l -1<br />
(±8.3) lower than me<strong>as</strong>ured concentration in the river, indicating a TN<br />
sink in the German Bight.<br />
Figure 2.3 Mean annual TN concentrations in River Elbe compared to estimated TN<br />
concentrations b<strong>as</strong>ed on the salinity-TN regression model. Data from 1996 were not included<br />
in the regression.<br />
Assuming that the l<strong>and</strong> use, <strong>and</strong> presumably nitrogen loss also, in the<br />
catchment are<strong>as</strong> <strong>of</strong> River Elbe <strong>and</strong> other contributing rivers is similar to<br />
the l<strong>and</strong> use in Denmark, equivalent TN concentrations calculated from<br />
TN inputs to the Danish straits in an average freshwater discharge year<br />
(Table 2.1) minus an average TN sink <strong>of</strong> 27.8 µmol l -1 were employed <strong>as</strong><br />
end-point members. Reference conditions <strong>and</strong> boundaries between ecological<br />
status cl<strong>as</strong>ses are therefore found <strong>as</strong> salinity-dependent lines<br />
starting at 13.18 µmol l -1 for salinity 35 <strong>and</strong> intersecting 0 salinity at 80,<br />
189, 403, 650, <strong>and</strong> 805 µmol l -1 (Table 2.2) for reference conditions, H-G<br />
boundary, G-M boundary, M-P boundary, <strong>and</strong> P-B boundary, respectively.<br />
Such reference conditions <strong>and</strong> boundaries were found for 4 sites<br />
along the west-co<strong>as</strong>t <strong>of</strong> Jutl<strong>and</strong> using average salinities characteristic for<br />
each site (Table 2.2). The uncertainty <strong>as</strong>sociated with these estimates derives<br />
from the estimated TN level at salinity 35 <strong>and</strong> the TN sink, since the<br />
TN concentrations at salinity 0 are fixed values. The values in Table 2.2<br />
will be used for deriving reference condition <strong>and</strong> boundary values for<br />
Nissum Fjord, Ringkøbing Fjord <strong>and</strong> the inner Wadden Sea.<br />
Table 2.2 Suggested reference conditions <strong>and</strong> boundary values for TN concentration (µmol l -1 ) normalised to st<strong>and</strong>ard salinity<br />
<strong>of</strong> 33 for Hirtshals, 31.7 for the co<strong>as</strong>tal area <strong>of</strong>f Nissum Fjord, 31.4 for the co<strong>as</strong>tal area <strong>of</strong>f Ringkøbing Fjord, <strong>and</strong> 30.4 for outer<br />
Wadden Sea.<br />
Intercalibration site Ref. cond. H-G G-M M-P P-B<br />
Hirtshals 17.0 (±0.7) 23.2 (±0.7) 35.5 (±0.7) 49.6 (±0.7) 58.4 (±0.7)<br />
Co<strong>as</strong>t <strong>of</strong>f Nissum Fjord 19.5 (±0.9) 29.8 (±0.9) 49.9 (±0.9) 73.2 (±0.9) 87.8 (±0.9)<br />
Co<strong>as</strong>t <strong>of</strong>f Ringkøbing Fjord 20.1 (±1.0) 31.3 (±1.0) 53.3 (±1.0) 78.7 (±1.0) 94.6 (±1.0)<br />
Outer Wadden Sea 22.0 (±1.2) 36.3 (±1.2) 64.4 (±1.2) 96.9 (±1.2) 117.3 (±1.2)<br />
12