Macroalgae and phytoplankton as indicators of ... - Naturstyrelsen
Macroalgae and phytoplankton as indicators of ... - Naturstyrelsen
Macroalgae and phytoplankton as indicators of ... - Naturstyrelsen
You also want an ePaper? Increase the reach of your titles
YUMPU automatically turns print PDFs into web optimized ePapers that Google loves.
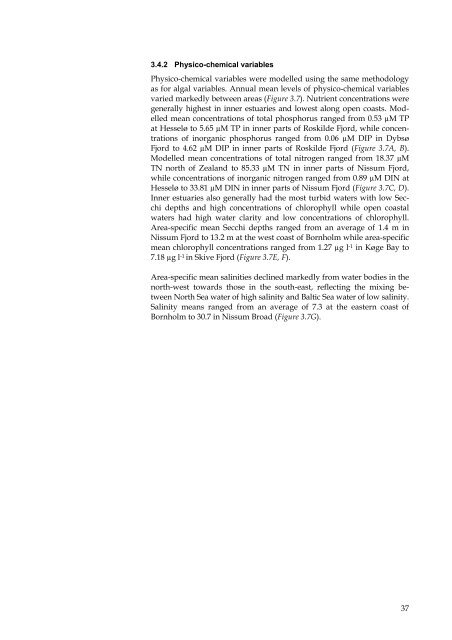
3.4.2 Physico-chemical variables<br />
Physico-chemical variables were modelled using the same methodology<br />
<strong>as</strong> for algal variables. Annual mean levels <strong>of</strong> physico-chemical variables<br />
varied markedly between are<strong>as</strong> (Figure 3.7). Nutrient concentrations were<br />
generally highest in inner estuaries <strong>and</strong> lowest along open co<strong>as</strong>ts. Modelled<br />
mean concentrations <strong>of</strong> total phosphorus ranged from 0.53 µM TP<br />
at Hesselø to 5.65 µM TP in inner parts <strong>of</strong> Roskilde Fjord, while concentrations<br />
<strong>of</strong> inorganic phosphorus ranged from 0.06 µM DIP in Dybsø<br />
Fjord to 4.62 µM DIP in inner parts <strong>of</strong> Roskilde Fjord (Figure 3.7A, B).<br />
Modelled mean concentrations <strong>of</strong> total nitrogen ranged from 18.37 µM<br />
TN north <strong>of</strong> Zeal<strong>and</strong> to 85.33 µM TN in inner parts <strong>of</strong> Nissum Fjord,<br />
while concentrations <strong>of</strong> inorganic nitrogen ranged from 0.89 µM DIN at<br />
Hesselø to 33.81 µM DIN in inner parts <strong>of</strong> Nissum Fjord (Figure 3.7C, D).<br />
Inner estuaries also generally had the most turbid waters with low Secchi<br />
depths <strong>and</strong> high concentrations <strong>of</strong> chlorophyll while open co<strong>as</strong>tal<br />
waters had high water clarity <strong>and</strong> low concentrations <strong>of</strong> chlorophyll.<br />
Area-specific mean Secchi depths ranged from an average <strong>of</strong> 1.4 m in<br />
Nissum Fjord to 13.2 m at the west co<strong>as</strong>t <strong>of</strong> Bornholm while area-specific<br />
mean chlorophyll concentrations ranged from 1.27 µg l -1 in Køge Bay to<br />
7.18 µg l -1 in Skive Fjord (Figure 3.7E, F).<br />
Area-specific mean salinities declined markedly from water bodies in the<br />
north-west towards those in the south-e<strong>as</strong>t, reflecting the mixing between<br />
North Sea water <strong>of</strong> high salinity <strong>and</strong> Baltic Sea water <strong>of</strong> low salinity.<br />
Salinity means ranged from an average <strong>of</strong> 7.3 at the e<strong>as</strong>tern co<strong>as</strong>t <strong>of</strong><br />
Bornholm to 30.7 in Nissum Broad (Figure 3.7G).<br />
37


