Macroalgae and phytoplankton as indicators of ... - Naturstyrelsen
Macroalgae and phytoplankton as indicators of ... - Naturstyrelsen
Macroalgae and phytoplankton as indicators of ... - Naturstyrelsen

You also want an ePaper? Increase the reach of your titles
YUMPU automatically turns print PDFs into web optimized ePapers that Google loves.
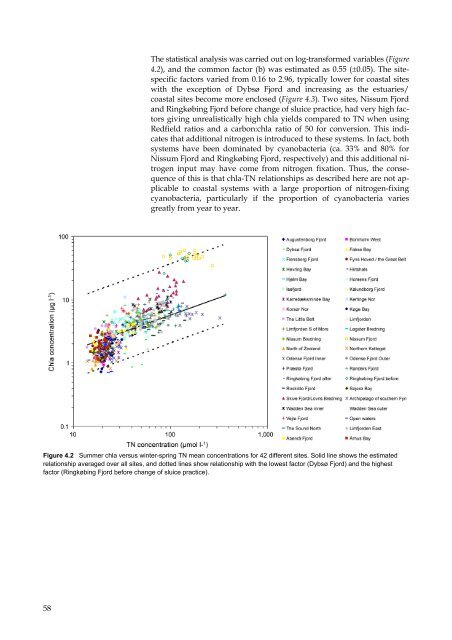
The statistical analysis w<strong>as</strong> carried out on log-transformed variables (Figure<br />
4.2), <strong>and</strong> the common factor (b) w<strong>as</strong> estimated <strong>as</strong> 0.55 (±0.05). The sitespecific<br />
factors varied from 0.16 to 2.96, typically lower for co<strong>as</strong>tal sites<br />
with the exception <strong>of</strong> Dybsø Fjord <strong>and</strong> incre<strong>as</strong>ing <strong>as</strong> the estuaries/<br />
co<strong>as</strong>tal sites become more enclosed (Figure 4.3). Two sites, Nissum Fjord<br />
<strong>and</strong> Ringkøbing Fjord before change <strong>of</strong> sluice practice, had very high factors<br />
giving unrealistically high chla yields compared to TN when using<br />
Redfield ratios <strong>and</strong> a carbon:chla ratio <strong>of</strong> 50 for conversion. This indicates<br />
that additional nitrogen is introduced to these systems. In fact, both<br />
systems have been dominated by cyanobacteria (ca. 33% <strong>and</strong> 80% for<br />
Nissum Fjord <strong>and</strong> Ringkøbing Fjord, respectively) <strong>and</strong> this additional nitrogen<br />
input may have come from nitrogen fixation. Thus, the consequence<br />
<strong>of</strong> this is that chla-TN relationships <strong>as</strong> described here are not applicable<br />
to co<strong>as</strong>tal systems with a large proportion <strong>of</strong> nitrogen-fixing<br />
cyanobacteria, particularly if the proportion <strong>of</strong> cyanobacteria varies<br />
greatly from year to year.<br />
Figure 4.2 Summer chla versus winter-spring TN mean concentrations for 42 different sites. Solid line shows the estimated<br />
relationship averaged over all sites, <strong>and</strong> dotted lines show relationship with the lowest factor (Dybsø Fjord) <strong>and</strong> the highest<br />
factor (Ringkøbing Fjord before change <strong>of</strong> sluice practice).<br />
58