Macroalgae and phytoplankton as indicators of ... - Naturstyrelsen
Macroalgae and phytoplankton as indicators of ... - Naturstyrelsen
Macroalgae and phytoplankton as indicators of ... - Naturstyrelsen

You also want an ePaper? Increase the reach of your titles
YUMPU automatically turns print PDFs into web optimized ePapers that Google loves.
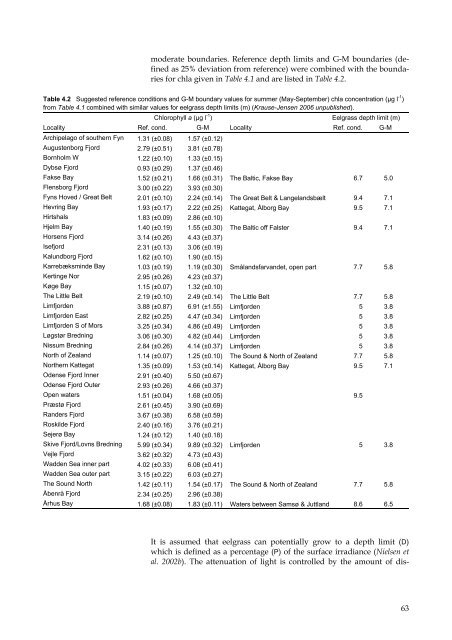
moderate boundaries. Reference depth limits <strong>and</strong> G-M boundaries (defined<br />
<strong>as</strong> 25% deviation from reference) were combined with the boundaries<br />
for chla given in Table 4.1 <strong>and</strong> are listed in Table 4.2.<br />
Table 4.2 Suggested reference conditions <strong>and</strong> G-M boundary values for summer (May-September) chla concentration (µg l -1 )<br />
from Table 4.1 combined with similar values for eelgr<strong>as</strong>s depth limits (m) (Krause-Jensen 2006 unpublished).<br />
Chlorophyll a (µg l -1 )<br />
Eelgr<strong>as</strong>s depth limit (m)<br />
Locality Ref. cond. G-M Locality Ref. cond. G-M<br />
Archipelago <strong>of</strong> southern Fyn 1.31 (±0.08) 1.57 (±0.12)<br />
Augustenborg Fjord 2.79 (±0.51) 3.81 (±0.78)<br />
Bornholm W 1.22 (±0.10) 1.33 (±0.15)<br />
Dybsø Fjord 0.93 (±0.29) 1.37 (±0.46)<br />
Fakse Bay 1.52 (±0.21) 1.66 (±0.31) The Baltic, Fakse Bay 6.7 5.0<br />
Flensborg Fjord 3.00 (±0.22) 3.93 (±0.30)<br />
Fyns Hoved / Great Belt 2.01 (±0.10) 2.24 (±0.14) The Great Belt & Langel<strong>and</strong>sbælt 9.4 7.1<br />
Hevring Bay 1.93 (±0.17) 2.22 (±0.25) Kattegat, Ålborg Bay 9.5 7.1<br />
Hirtshals 1.83 (±0.09) 2.86 (±0.10)<br />
Hjelm Bay 1.40 (±0.19) 1.55 (±0.30) The Baltic <strong>of</strong>f Falster 9.4 7.1<br />
Horsens Fjord 3.14 (±0.26) 4.43 (±0.37)<br />
Isefjord 2.31 (±0.13) 3.06 (±0.19)<br />
Kalundborg Fjord 1.62 (±0.10) 1.90 (±0.15)<br />
Karrebæksminde Bay 1.03 (±0.19) 1.19 (±0.30) Smål<strong>and</strong>sfarv<strong>and</strong>et, open part 7.7 5.8<br />
Kertinge Nor 2.95 (±0.26) 4.23 (±0.37)<br />
Køge Bay 1.15 (±0.07) 1.32 (±0.10)<br />
The Little Belt 2.19 (±0.10) 2.49 (±0.14) The Little Belt 7.7 5.8<br />
Limfjorden 3.88 (±0.87) 6.91 (±1.55) Limfjorden 5 3.8<br />
Limfjorden E<strong>as</strong>t 2.82 (±0.25) 4.47 (±0.34) Limfjorden 5 3.8<br />
Limfjorden S <strong>of</strong> Mors 3.25 (±0.34) 4.86 (±0.49) Limfjorden 5 3.8<br />
Løgstør Bredning 3.06 (±0.30) 4.82 (±0.44) Limfjorden 5 3.8<br />
Nissum Bredning 2.84 (±0.26) 4.14 (±0.37) Limfjorden 5 3.8<br />
North <strong>of</strong> Zeal<strong>and</strong> 1.14 (±0.07) 1.25 (±0.10) The Sound & North <strong>of</strong> Zeal<strong>and</strong> 7.7 5.8<br />
Northern Kattegat 1.35 (±0.09) 1.53 (±0.14) Kattegat, Ålborg Bay 9.5 7.1<br />
Odense Fjord Inner 2.91 (±0.40) 5.50 (±0.67)<br />
Odense Fjord Outer 2.93 (±0.26) 4.66 (±0.37)<br />
Open waters 1.51 (±0.04) 1.68 (±0.05) 9.5<br />
Præstø Fjord 2.61 (±0.45) 3.90 (±0.69)<br />
R<strong>and</strong>ers Fjord 3.67 (±0.38) 6.58 (±0.59)<br />
Roskilde Fjord 2.40 (±0.16) 3.76 (±0.21)<br />
Sejerø Bay 1.24 (±0.12) 1.40 (±0.18)<br />
Skive Fjord/Lovns Bredning 5.99 (±0.34) 9.89 (±0.32) Limfjorden 5 3.8<br />
Vejle Fjord 3.62 (±0.32) 4.73 (±0.43)<br />
Wadden Sea inner part 4.02 (±0.33) 6.08 (±0.41)<br />
Wadden Sea outer part 3.15 (±0.22) 6.03 (±0.27)<br />
The Sound North 1.42 (±0.11) 1.54 (±0.17) The Sound & North <strong>of</strong> Zeal<strong>and</strong> 7.7 5.8<br />
Åbenrå Fjord 2.34 (±0.25) 2.96 (±0.38)<br />
Århus Bay 1.68 (±0.08) 1.83 (±0.11) Waters between Samsø & Juttl<strong>and</strong> 8.6 6.5<br />
It is <strong>as</strong>sumed that eelgr<strong>as</strong>s can potentially grow to a depth limit (D)<br />
which is defined <strong>as</strong> a percentage (P) <strong>of</strong> the surface irradiance (Nielsen et<br />
al. 2002b). The attenuation <strong>of</strong> light is controlled by the amount <strong>of</strong> dis-<br />
63