Macroalgae and phytoplankton as indicators of ... - Naturstyrelsen
Macroalgae and phytoplankton as indicators of ... - Naturstyrelsen
Macroalgae and phytoplankton as indicators of ... - Naturstyrelsen

You also want an ePaper? Increase the reach of your titles
YUMPU automatically turns print PDFs into web optimized ePapers that Google loves.
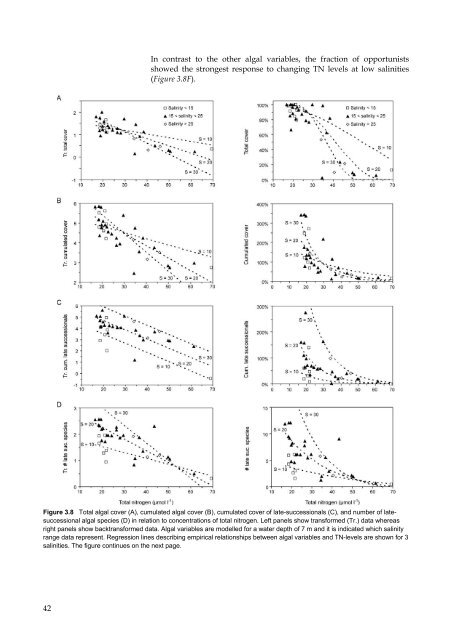
In contr<strong>as</strong>t to the other algal variables, the fraction <strong>of</strong> opportunists<br />
showed the strongest response to changing TN levels at low salinities<br />
(Figure 3.8F).<br />
Figure 3.8 Total algal cover (A), cumulated algal cover (B), cumulated cover <strong>of</strong> late-successionals (C), <strong>and</strong> number <strong>of</strong> latesuccessional<br />
algal species (D) in relation to concentrations <strong>of</strong> total nitrogen. Left panels show transformed (Tr.) data where<strong>as</strong><br />
right panels show backtransformed data. Algal variables are modelled for a water depth <strong>of</strong> 7 m <strong>and</strong> it is indicated which salinity<br />
range data represent. Regression lines describing empirical relationships between algal variables <strong>and</strong> TN-levels are shown for 3<br />
salinities. The figure continues on the next page.<br />
42