Macroalgae and phytoplankton as indicators of ... - Naturstyrelsen
Macroalgae and phytoplankton as indicators of ... - Naturstyrelsen
Macroalgae and phytoplankton as indicators of ... - Naturstyrelsen

Create successful ePaper yourself
Turn your PDF publications into a flip-book with our unique Google optimized e-Paper software.
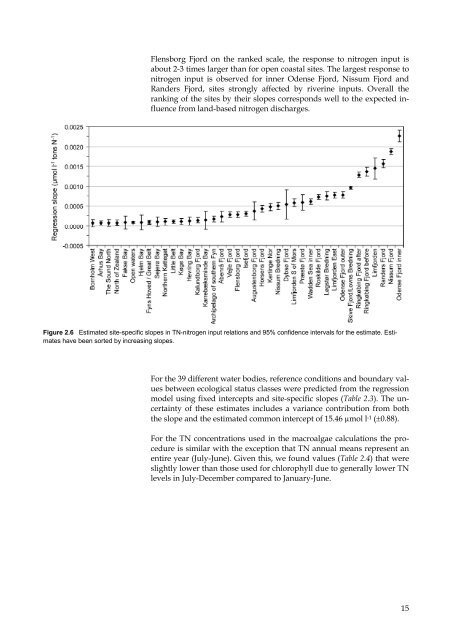
Flensborg Fjord on the ranked scale, the response to nitrogen input is<br />
about 2-3 times larger than for open co<strong>as</strong>tal sites. The largest response to<br />
nitrogen input is observed for inner Odense Fjord, Nissum Fjord <strong>and</strong><br />
R<strong>and</strong>ers Fjord, sites strongly affected by riverine inputs. Overall the<br />
ranking <strong>of</strong> the sites by their slopes corresponds well to the expected influence<br />
from l<strong>and</strong>-b<strong>as</strong>ed nitrogen discharges.<br />
Figure 2.6 Estimated site-specific slopes in TN-nitrogen input relations <strong>and</strong> 95% confidence intervals for the estimate. Estimates<br />
have been sorted by incre<strong>as</strong>ing slopes.<br />
For the 39 different water bodies, reference conditions <strong>and</strong> boundary values<br />
between ecological status cl<strong>as</strong>ses were predicted from the regression<br />
model using fixed intercepts <strong>and</strong> site-specific slopes (Table 2.3). The uncertainty<br />
<strong>of</strong> these estimates includes a variance contribution from both<br />
the slope <strong>and</strong> the estimated common intercept <strong>of</strong> 15.46 µmol l -1 (±0.88).<br />
For the TN concentrations used in the macroalgae calculations the procedure<br />
is similar with the exception that TN annual means represent an<br />
entire year (July-June). Given this, we found values (Table 2.4) that were<br />
slightly lower than those used for chlorophyll due to generally lower TN<br />
levels in July-December compared to January-June.<br />
15