Macroalgae and phytoplankton as indicators of ... - Naturstyrelsen
Macroalgae and phytoplankton as indicators of ... - Naturstyrelsen
Macroalgae and phytoplankton as indicators of ... - Naturstyrelsen

You also want an ePaper? Increase the reach of your titles
YUMPU automatically turns print PDFs into web optimized ePapers that Google loves.
We <strong>as</strong>sumed that mean values from the various algal sites would represent<br />
the algae <strong>of</strong> a given co<strong>as</strong>tal area <strong>and</strong> that the centrally located water<br />
chemistry site would represent the physical conditions <strong>and</strong> water chemistry<br />
<strong>of</strong> the same co<strong>as</strong>tal area in spite <strong>of</strong> some distance between macroalgal<br />
<strong>and</strong> water chemistry sites.<br />
Water chemistry data were collected by the Danish counties <strong>and</strong> stored<br />
in NERI's datab<strong>as</strong>e. Sampling <strong>and</strong> chemical analysis were performed according<br />
to common guidelines (Andersen et al. 2004) <strong>and</strong> typically represented<br />
a sampling frequency between weekly <strong>and</strong> monthly sampling.<br />
3.3.4 Statistical analyses <strong>of</strong> algal variables<br />
Algal model<br />
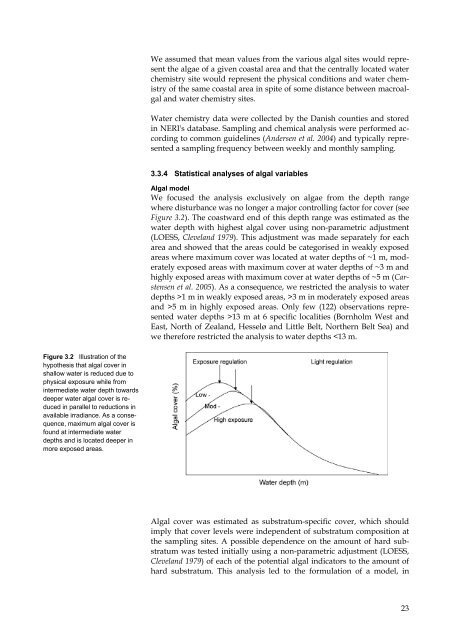
We focused the analysis exclusively on algae from the depth range<br />
where disturbance w<strong>as</strong> no longer a major controlling factor for cover (see<br />
Figure 3.2). The co<strong>as</strong>tward end <strong>of</strong> this depth range w<strong>as</strong> estimated <strong>as</strong> the<br />
water depth with highest algal cover using non-parametric adjustment<br />
(LOESS, Clevel<strong>and</strong> 1979). This adjustment w<strong>as</strong> made separately for each<br />
area <strong>and</strong> showed that the are<strong>as</strong> could be categorised in weakly exposed<br />
are<strong>as</strong> where maximum cover w<strong>as</strong> located at water depths <strong>of</strong> ~1 m, moderately<br />
exposed are<strong>as</strong> with maximum cover at water depths <strong>of</strong> ~3 m <strong>and</strong><br />
highly exposed are<strong>as</strong> with maximum cover at water depths <strong>of</strong> ~5 m (Carstensen<br />
et al. 2005). As a consequence, we restricted the analysis to water<br />
depths >1 m in weakly exposed are<strong>as</strong>, >3 m in moderately exposed are<strong>as</strong><br />
<strong>and</strong> >5 m in highly exposed are<strong>as</strong>. Only few (122) observations represented<br />
water depths >13 m at 6 specific localities (Bornholm West <strong>and</strong><br />
E<strong>as</strong>t, North <strong>of</strong> Zeal<strong>and</strong>, Hesselø <strong>and</strong> Little Belt, Northern Belt Sea) <strong>and</strong><br />
we therefore restricted the analysis to water depths