Macroalgae and phytoplankton as indicators of ... - Naturstyrelsen
Macroalgae and phytoplankton as indicators of ... - Naturstyrelsen
Macroalgae and phytoplankton as indicators of ... - Naturstyrelsen

You also want an ePaper? Increase the reach of your titles
YUMPU automatically turns print PDFs into web optimized ePapers that Google loves.
A<br />
100<br />
B<br />
140<br />
Total algal cover (%)<br />
80<br />
60<br />
40<br />
20<br />
0<br />
HIGH<br />
GOOD<br />
MODERATE<br />
Ref. H-G G-M M-P P-B 2001 2003 2005<br />
Cummulated algal cover (%)<br />
120<br />
100<br />
80<br />
60<br />
40<br />
20<br />
0<br />
HIGH<br />
GOOD<br />
MODERATE<br />
POOR<br />
BAD<br />
Ref. H-G G-M M-P P-B 2001 2003 2005<br />
C<br />
E<br />
Cum. cover <strong>of</strong> late successionals (%)<br />
35<br />
30<br />
25<br />
20<br />
15<br />
10<br />
5<br />
0<br />
HIGH<br />
GOOD<br />
MODERATE<br />
Ref. H-G G-M M-P P-B 2001 2003 2005<br />
D<br />
F<br />
Cum. cover <strong>of</strong> opportunists (%)<br />
60<br />
50<br />
40<br />
30<br />
20<br />
10<br />
0<br />
5<br />
HIGH<br />
GOOD<br />
MODERATE<br />
POOR<br />
BAD<br />
Ref. H-G G-M M-P P-B 2001 2003 2005<br />
Fraction <strong>of</strong> opportunists (%)<br />
100<br />
90<br />
80<br />
70<br />
60<br />
50<br />
GOOD<br />
HIGH<br />
Ref. H-G G-M M-P P-B 2001 2003 2005<br />
Number <strong>of</strong> late successionals<br />
4<br />
3<br />
2<br />
1<br />
0<br />
-1<br />
HIGH<br />
GOOD<br />
MODERATE<br />
POOR<br />
BAD<br />
Ref. H-G G-M M-P P-B 2001 2003 2005<br />
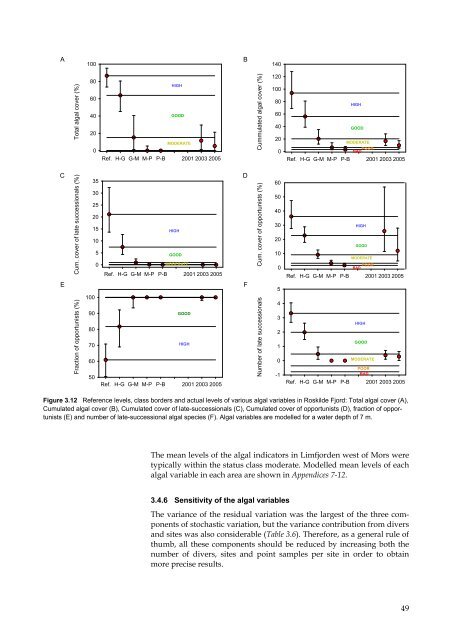
Figure 3.12 Reference levels, cl<strong>as</strong>s borders <strong>and</strong> actual levels <strong>of</strong> various algal variables in Roskilde Fjord: Total algal cover (A),<br />
Cumulated algal cover (B), Cumulated cover <strong>of</strong> late-successionals (C), Cumulated cover <strong>of</strong> opportunists (D), fraction <strong>of</strong> opportunists<br />
(E) <strong>and</strong> number <strong>of</strong> late-successional algal species (F). Algal variables are modelled for a water depth <strong>of</strong> 7 m.<br />
The mean levels <strong>of</strong> the algal <strong>indicators</strong> in Limfjorden west <strong>of</strong> Mors were<br />
typically within the status cl<strong>as</strong>s moderate. Modelled mean levels <strong>of</strong> each<br />
algal variable in each area are shown in Appendices 7-12.<br />
3.4.6 Sensitivity <strong>of</strong> the algal variables<br />
The variance <strong>of</strong> the residual variation w<strong>as</strong> the largest <strong>of</strong> the three components<br />
<strong>of</strong> stoch<strong>as</strong>tic variation, but the variance contribution from divers<br />
<strong>and</strong> sites w<strong>as</strong> also considerable (Table 3.6). Therefore, <strong>as</strong> a general rule <strong>of</strong><br />
thumb, all these components should be reduced by incre<strong>as</strong>ing both the<br />
number <strong>of</strong> divers, sites <strong>and</strong> point samples per site in order to obtain<br />
more precise results.<br />
49