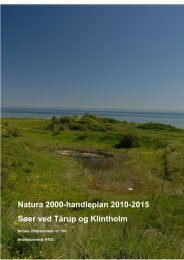
Macroalgae and phytoplankton as indicators of ... - Naturstyrelsen
Macroalgae and phytoplankton as indicators of ... - Naturstyrelsen
Macroalgae and phytoplankton as indicators of ... - Naturstyrelsen

You also want an ePaper? Increase the reach of your titles
YUMPU automatically turns print PDFs into web optimized ePapers that Google loves.
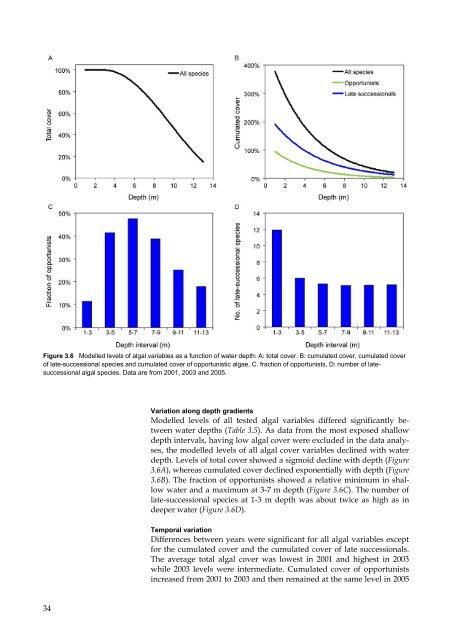
Figure 3.6 Modelled levels <strong>of</strong> algal variables <strong>as</strong> a function <strong>of</strong> water depth: A: total cover. B: cumulated cover, cumulated cover<br />
<strong>of</strong> late-successional species <strong>and</strong> cumulated cover <strong>of</strong> opportunistic algae, C. fraction <strong>of</strong> opportunists, D: number <strong>of</strong> latesuccessional<br />
algal species. Data are from 2001, 2003 <strong>and</strong> 2005.<br />
Variation along depth gradients<br />
Modelled levels <strong>of</strong> all tested algal variables differed significantly between<br />
water depths (Table 3.5). As data from the most exposed shallow<br />
depth intervals, having low algal cover were excluded in the data analyses,<br />
the modelled levels <strong>of</strong> all algal cover variables declined with water<br />
depth. Levels <strong>of</strong> total cover showed a sigmoid decline with depth (Figure<br />
3.6A), where<strong>as</strong> cumulated cover declined exponentially with depth (Figure<br />
3.6B). The fraction <strong>of</strong> opportunists showed a relative minimum in shallow<br />
water <strong>and</strong> a maximum at 3-7 m depth (Figure 3.6C). The number <strong>of</strong><br />
late-successional species at 1-3 m depth w<strong>as</strong> about twice <strong>as</strong> high <strong>as</strong> in<br />
deeper water (Figure 3.6D).<br />
Temporal variation<br />
Differences between years were significant for all algal variables except<br />
for the cumulated cover <strong>and</strong> the cumulated cover <strong>of</strong> late successionals.<br />
The average total algal cover w<strong>as</strong> lowest in 2001 <strong>and</strong> highest in 2003<br />
while 2003 levels were intermediate. Cumulated cover <strong>of</strong> opportunists<br />
incre<strong>as</strong>ed from 2001 to 2003 <strong>and</strong> then remained at the same level in 2005<br />
34