Macroalgae and phytoplankton as indicators of ... - Naturstyrelsen
Macroalgae and phytoplankton as indicators of ... - Naturstyrelsen
Macroalgae and phytoplankton as indicators of ... - Naturstyrelsen

Create successful ePaper yourself
Turn your PDF publications into a flip-book with our unique Google optimized e-Paper software.
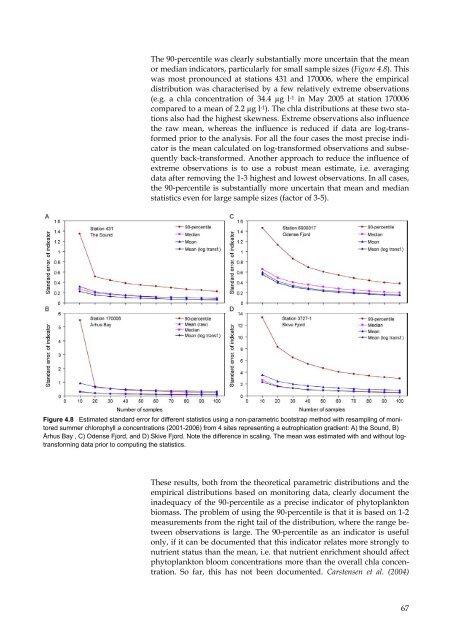
The 90-percentile w<strong>as</strong> clearly substantially more uncertain that the mean<br />
or median <strong>indicators</strong>, particularly for small sample sizes (Figure 4.8). This<br />
w<strong>as</strong> most pronounced at stations 431 <strong>and</strong> 170006, where the empirical<br />
distribution w<strong>as</strong> characterised by a few relatively extreme observations<br />
(e.g. a chla concentration <strong>of</strong> 34.4 µg l -1 in May 2005 at station 170006<br />
compared to a mean <strong>of</strong> 2.2 µg l -1 ). The chla distributions at these two stations<br />
also had the highest skewness. Extreme observations also influence<br />
the raw mean, where<strong>as</strong> the influence is reduced if data are log-transformed<br />
prior to the analysis. For all the four c<strong>as</strong>es the most precise indicator<br />
is the mean calculated on log-transformed observations <strong>and</strong> subsequently<br />
back-transformed. Another approach to reduce the influence <strong>of</strong><br />
extreme observations is to use a robust mean estimate, i.e. averaging<br />
data after removing the 1-3 highest <strong>and</strong> lowest observations. In all c<strong>as</strong>es,<br />
the 90-percentile is substantially more uncertain that mean <strong>and</strong> median<br />
statistics even for large sample sizes (factor <strong>of</strong> 3-5).<br />
Figure 4.8 Estimated st<strong>and</strong>ard error for different statistics using a non-parametric bootstrap method with resampling <strong>of</strong> monitored<br />
summer chlorophyll a concentrations (2001-2006) from 4 sites representing a eutrophication gradient: A) the Sound, B)<br />
Århus Bay , C) Odense Fjord, <strong>and</strong> D) Skive Fjord. Note the difference in scaling. The mean w<strong>as</strong> estimated with <strong>and</strong> without logtransforming<br />
data prior to computing the statistics.<br />
These results, both from the theoretical parametric distributions <strong>and</strong> the<br />
empirical distributions b<strong>as</strong>ed on monitoring data, clearly document the<br />
inadequacy <strong>of</strong> the 90-percentile <strong>as</strong> a precise indicator <strong>of</strong> <strong>phytoplankton</strong><br />
biom<strong>as</strong>s. The problem <strong>of</strong> using the 90-percentile is that it is b<strong>as</strong>ed on 1-2<br />
me<strong>as</strong>urements from the right tail <strong>of</strong> the distribution, where the range between<br />
observations is large. The 90-percentile <strong>as</strong> an indicator is useful<br />
only, if it can be documented that this indicator relates more strongly to<br />
nutrient status than the mean, i.e. that nutrient enrichment should affect<br />
<strong>phytoplankton</strong> bloom concentrations more than the overall chla concentration.<br />
So far, this h<strong>as</strong> not been documented. Carstensen et al. (2004)<br />
67