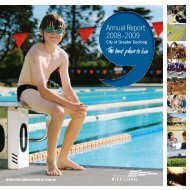
ANNUAL REPORT 2007-2008 CITY OF GREATER GEELONG
ANNUAL REPORT 2007-2008 CITY OF GREATER GEELONG
ANNUAL REPORT 2007-2008 CITY OF GREATER GEELONG

Create successful ePaper yourself
Turn your PDF publications into a flip-book with our unique Google optimized e-Paper software.
<strong>CITY</strong> <strong>OF</strong> <strong>GREATER</strong> <strong>GEELONG</strong><br />
NOTES TO THE FINANCIAL <strong>REPORT</strong> FOR THE YEAR ENDED 30 JUNE <strong>2008</strong><br />
41 Capital expenditure<br />
<strong>2008</strong> <strong>2007</strong><br />
Note $000 $000<br />
Capital expenditure areas<br />
Infrastructure Leisure 16,333 13,545<br />
Roads 11,141 9,071<br />
Fleet 4,697 4,308<br />
Buildings 5,013 4,184<br />
Drains 2,603 5,163<br />
Computer Equipment 1,393 1,294<br />
Streetscapes 1,199 2,743<br />
Footpaths 1,547 1,490<br />
Other 2,351 62<br />
Kerb and Channel 616 618<br />
Land 1,293 2,821<br />
Waste Collection 1,791 1,366<br />
Plant and Equipment 780 767<br />
Special Rates and Charges Program 1,684 1,635<br />
Total capital works 52,441 49,067<br />
Represented by:<br />
Renewal (a) 15,598 16,463<br />
Upgrade (b) 14,192 16,434<br />
New assets 22,651 16,170<br />
Total capital works 52,441 49,067<br />
Property, infrastructure, plant and equipment movement<br />
The movement between the previous year and the current year in property, infrastructure, plant and equipment as shown in the<br />
Balance Sheet links to the net of the following items:<br />
Total capital works 52,441 49,067<br />
Expensed from Work in Progress 21 (986) (806)<br />
Landfill expensed to provision 26 (578) (1,191)<br />
Asset revaluation movement 28 50,011 9,391<br />
Depreciation and Other Write Downs 10 (38,954) (38,209)<br />
Written down value of assets sold 11 (2,581) (3,114)<br />
Recognition of Infrastructure 13,009 30,417<br />
Capitalised Salaries Expensed (64) -<br />
Net movement in property, plant and equipment 21 72,298 45,555<br />
186