ANNUAL REPORT 2007-2008 CITY OF GREATER GEELONG
ANNUAL REPORT 2007-2008 CITY OF GREATER GEELONG
ANNUAL REPORT 2007-2008 CITY OF GREATER GEELONG

You also want an ePaper? Increase the reach of your titles
YUMPU automatically turns print PDFs into web optimized ePapers that Google loves.
% 0<br />
1 2<br />
3 4 5<br />
6 7<br />
Financial Results<br />
<strong>CITY</strong> <strong>OF</strong> <strong>GREATER</strong> <strong>GEELONG</strong> <strong>ANNUAL</strong> <strong>REPORT</strong> <strong>2007</strong>-<strong>2008</strong><br />
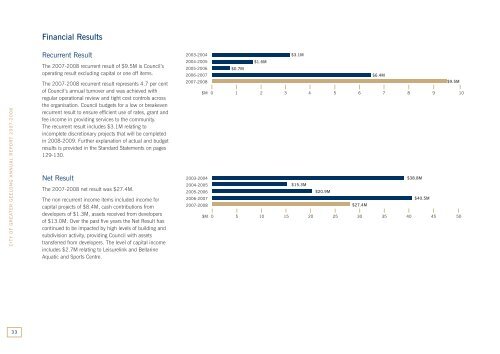
Recurrent Result<br />
The <strong>2007</strong>-<strong>2008</strong> recurrent result of $9.5M is Council’s<br />
operating result excluding capital or one off items.<br />
The <strong>2007</strong>-<strong>2008</strong> recurrent result represents 4.7 per cent<br />
of Council’s annual turnover and was achieved with<br />
regular operational review and tight cost controls across<br />
the organisation. Council budgets for a low or breakeven<br />
recurrent result to ensure efficient use of rates, grant and<br />
fee income in providing services to the community.<br />
The recurrent result includes $3.1M relating to<br />
incomplete discretionary projects that will be completed<br />
in <strong>2008</strong>-2009. Further explanation of actual and budget<br />
results is provided in the Standard Statements on pages<br />
129-130.<br />
Net Result<br />
The <strong>2007</strong>-<strong>2008</strong> net result was $27.4M.<br />
The non recurrent income items included income for<br />
capital projects of $8.4M, cash contributions from<br />
developers of $1.3M, assets received from developers<br />
of $13.0M. Over the past five years the Net Result has<br />
continued to be impacted by high levels of building and<br />
subdivision activity, providing Council with assets<br />
transferred from developers. The level of capital income<br />
includes $2.7M relating to Leisurelink and Bellarine<br />
Aquatic and Sports Centre.<br />
2003-2004<br />
2004-2005<br />
2005-2006<br />
2006-<strong>2007</strong><br />
<strong>2007</strong>-<strong>2008</strong><br />
$0.7M<br />
$1.6M<br />
$3.1M<br />
2003-2004 $M 0<br />
1 2<br />
3 $3.1M 4 5<br />
6 7 8 9 10<br />
2004-2005<br />
$1.6M<br />
2005-2006<br />
$0.7M<br />
2006-<strong>2007</strong><br />
$6.4M<br />
<strong>2007</strong>-<strong>2008</strong><br />
$9.5M<br />
$M 0<br />
1 2<br />
3 4 5<br />
6 7 8 9 10<br />
2003-2004<br />
$38.8M<br />
2004-2005<br />
$15.3M<br />
2005-2006<br />
$20.9M<br />
2006-<strong>2007</strong><br />
$40.5M<br />
<strong>2007</strong>-<strong>2008</strong><br />
$27.4M<br />
2003-2004 $M 0<br />
5 10 15 20 25 30 35 40 $38.8M 45 50<br />
2004-2005<br />
$15.3M<br />
2005-2006<br />
$20.9M<br />
2006-<strong>2007</strong><br />
$40.5M<br />
<strong>2007</strong>-<strong>2008</strong><br />
$27.4M<br />
2003-2004<br />
2004-2005<br />
2005-2006<br />
2006-<strong>2007</strong><br />
<strong>2007</strong>-<strong>2008</strong><br />
$M 0<br />
5 10 15 20 25 30 35 40 45 50<br />
$12.5M<br />
$15.9M<br />
$15.9M<br />
$16.6M<br />
$14.7M<br />
$6.4M<br />
$9.5M<br />
2003-2004 $M 0<br />
5 10<br />
15 $15.9M 20 25<br />
30 35<br />
2004-2005<br />
$12.5M<br />
2005-2006<br />
$15.9M<br />
2006-<strong>2007</strong><br />
$16.6M<br />
<strong>2007</strong>-<strong>2008</strong><br />
$14.7M<br />
$M 0<br />
5 10<br />
15 20 25<br />
30 35<br />
2003-2004<br />
2004-2005<br />
4.76%<br />
6.02%<br />
33<br />
2005-2006<br />
2006-<strong>2007</strong><br />
<strong>2007</strong>-<strong>2008</strong><br />
4.40%<br />
4.83%<br />
5.08%