ANNUAL REPORT 2007-2008 CITY OF GREATER GEELONG
ANNUAL REPORT 2007-2008 CITY OF GREATER GEELONG
ANNUAL REPORT 2007-2008 CITY OF GREATER GEELONG

Create successful ePaper yourself
Turn your PDF publications into a flip-book with our unique Google optimized e-Paper software.
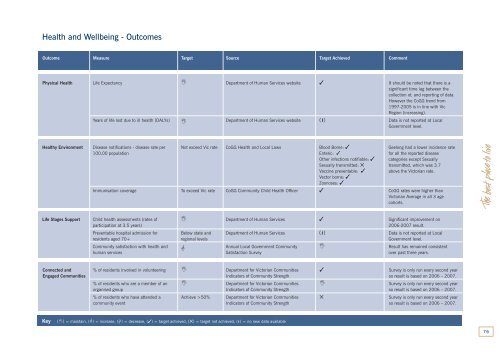
Health and Wellbeing - Outcomes<br />
Outcome Measure Target Source Target Achieved Comment<br />
Physical Health Life Expectancy Department of Human Services website ✓ It should be noted that there is a<br />
significant time lag between the<br />
collection of, and reporting of data.<br />
However the CoGG trend from<br />
1997-2005 is in line with Vic<br />
Region (increasing).<br />
Years of life lost due to ill health (DALYs)<br />
Department of Human Services website (i ) Data is not reported at Local<br />
Government level.<br />
Healthy Environment Disease notifications - disease rate per Not exceed Vic rate CoGG Health and Local Laws Blood Borne: ✓ Geelong had a lower incidence rate<br />
100,00 population Enteric: ✓ for all the reported disease<br />
Other infections notifiable: ✓ categories except Sexually<br />
Sexually transmitted: ✕ transmitted, which was 3.7<br />
Vaccine preventable: ✓<br />
above the Victorian rate.<br />
Vector borne: ✓<br />
Zoonoses: ✓<br />
Imm unisation coverage To exceed Vic rate CoGG Community Child Health Officer ✓ CoGG rates were higher than<br />
Victorian Average in all 3 age<br />
cohorts.<br />
Life Stages Support Child health assessments (rates of Department of Human Services ✓ Significant improvement on<br />
participation at 3.5 years)<br />
2006-<strong>2007</strong> result.<br />
Preventable hospital admission for Below state and Department of Human Services (i) Data is not reported at Local<br />
residents aged 70+ regional levels Government level.<br />
Community satisfaction with health and<br />
<br />
Annual Local Government Community Result has remained consistent<br />
human services Satisfaction Survey over past three years.<br />
Connected and % of residents involved in volunteering Department for Victorian Communities ✓ Survey is only run every second year<br />
Engaged Communities Indicators of Community Strength so result is based on 2006 – <strong>2007</strong>.<br />
% of residents who are a member of an Department for Victorian Communities Survey is only run every second year<br />
organised group Indicators of Community Strength so result is based on 2006 – <strong>2007</strong>.<br />
% of residents who have attended a Achieve >50% Department for Victorian Communities ✕ Survey is only run every second year<br />
community event Indicators of Community Strength so result is based on 2006 – <strong>2007</strong>.<br />
Key<br />
() = maintain, () = increase, () = decrease, (✓) = target achieved, (✕) = target not achieved, (i ) = no new data available<br />
76