- Page 1 and 2: European Commission COST European c
- Page 5 and 6: European Commission COST European c
- Page 7: Preface The Final Workshop of the C
- Page 11 and 12: COST 507 STRUCTURE Measurement and
- Page 13: GRl: Mirtee S.A., Volos Mr.P.Polati
- Page 16 and 17: D9 Dll Fl GR2 II NI S3 SF1 "Thermop
- Page 19 and 20: A Summary of the COST 507 Action an
- Page 21 and 22: Aluminium-based systems Titanium-ba
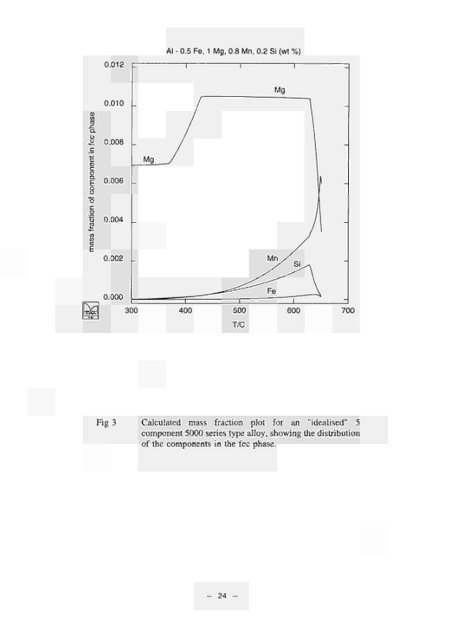
- Page 23 and 24: An Example using the COST 507 Datab
- Page 25 and 26: Appendix COST 507: Some Key Meeting
- Page 27: Al - 0.5 Fe, 1 Mg, 0.8 Mn, 0.2 Si (
- Page 31: Fig 6 High pressure compressor vane
- Page 34 and 35: INTRODUCTION All of us are aware of
- Page 36 and 37: In the interaction with materials a
- Page 38 and 39: There was a first warning more than
- Page 40 and 41: Some time ago, the well-known physi
- Page 42 and 43: Today there is a whole range of ins
- Page 44 and 45: The dimension of this reservoir inc
- Page 46 and 47: REFERENCES [ 1 ] G. Petzow, "Man, M
- Page 48 and 49: Trends in Application of Materials
- Page 50 and 51: Raw Materials The Cycle of Material
- Page 52 and 53: i LÌ i.'»Af·· iù^ VV.V.X. iTTa
- Page 54 and 55: 1600 OJ 1200 .« 1100 d 1000 900 Si
- Page 57 and 58: Al Phase Relations in the Aluminium
- Page 59 and 60: oundaries of the single phase regio
- Page 61 and 62: Table 1 : Crystallographic Data of
- Page 63 and 64: order to facilitate the evaluation
- Page 65 and 66: (especially around 33 at% Mg) in or
- Page 67 and 68: 3.System Ti-Sn-Al-N. The investigat
- Page 69 and 70: 6) N.Durlu, U.Gruber, M.Pietzka, H.
- Page 71 and 72: Summary of final report Directional
- Page 73 and 74: calculate the thermodynamic mixing
- Page 75 and 76: Introduction It is the aim of this
- Page 77 and 78: Thermodynamic evaluations for high
- Page 79 and 80:
Figure 5 presents the calculated li
- Page 81 and 82:
There is a complete lack in the lit
- Page 83 and 84:
a.B5 ø.ia 0.15 0.20 0.25 0.30 0.35
- Page 85 and 86:
700 [53Phi] 800 +[90Kuz21 ]iquld a
- Page 87 and 88:
Thermodynamic Assessments, Experime
- Page 89 and 90:
AIN and TiNi_ x is also given. Vari
- Page 91 and 92:
satisfied the three requirements of
- Page 93 and 94:
84Bey R. Beyers, R. Sinclair, and M
- Page 95 and 96:
Material and Methods 2.1 Fabricatio
- Page 97 and 98:
3.4 Electronmicroscopy (SEM) and X-
- Page 99 and 100:
Tab. 3: Density of the Ti20Albase
- Page 101 and 102:
Tab.5. continued TÌ20A1 5CulONi Ti
- Page 103 and 104:
Fig. 3: ESMA and Xray diffraction
- Page 105 and 106:
Fig.7: Wetting angle of Ti 15A1 lOC
- Page 107 and 108:
Thermophysical Properties of Light
- Page 109 and 110:
Tab.2 Chemical composition of terna
- Page 111 and 112:
700 (AI)+AIFeS¡«_600 KS1275.1 l
- Page 113 and 114:
4.2 Thermal conductivity of industr
- Page 115 and 116:
4.3 AlSiZn alloys Electrical re
- Page 117 and 118:
94Jar/Bra G.Jaroma-Weiland, R.Brand
- Page 119 and 120:
MgZn9 (C 14) and Mg2Zn u in the Al
- Page 121 and 122:
The three Laves phases were describ
- Page 123 and 124:
References [13Ege] G. Eger, Z. Meta
- Page 125 and 126:
0.30 0.35 0.40 0.45 0.50 mole fract
- Page 127 and 128:
□ [48Koe] 600 500 400 0 0.1 0
- Page 129 and 130:
MggZn,, this work □ Single phase,
- Page 131 and 132:
Temperatures in °C 0.05 0.10 mole
- Page 133 and 134:
Table 2 : Alloy compositions Alloy
- Page 135 and 136:
All. Dy 50 Cpexp °C Cpadd Table 5
- Page 137 and 138:
Zn ¿Kl Si Fig. 2 : Position of the
- Page 139 and 140:
22.5 ■■ 7.5 Temperature ICI Tem
- Page 141 and 142:
.to 2.5 "lõõ soo iÍOõ dOõ rtõ
- Page 143 and 144:
GR2 Differential Scanning Calorimet
- Page 145 and 146:
Time (x10 3 sec) Fig. 1. DSC Thermo
- Page 147 and 148:
solidification. It can be seen that
- Page 149 and 150:
4. Conclusions Differential scannin
- Page 151 and 152:
COST 507 - ROUND Π UNIT II SEZIONE
- Page 153 and 154:
[96Sac] The Rrich regions of the
- Page 155 and 156:
List of publications in the framewo
- Page 157 and 158:
2Contributions: oral or posters p
- Page 159 and 160:
1996 REPORT 2 s ' PART: ACTIVITY CA
- Page 161 and 162:
[96Sei] Excess Gibbs energy coeffic
- Page 163 and 164:
List of publications in the framewo
- Page 165 and 166:
Proc. :7 th Meeting on "Syntheses a
- Page 167 and 168:
2.1 Solid solubility measurements T
- Page 169 and 170:
eviews by Rivlin and Raynor [81 Riv
- Page 171 and 172:
inaires. Thesis, Universite Scienti
- Page 173 and 174:
Table 1. Review of the ternary phas
- Page 175 and 176:
L) Liq+bcc=FeSi+t_1 M) Liq+t 1=FeSi
- Page 177 and 178:
Extrapolations based on Ti-C-N S3 B
- Page 179 and 180:
value has been accepted in all thre
- Page 181 and 182:
with high precision whereas Jonsson
- Page 183 and 184:
only fit the hightemperature asym
- Page 185 and 186:
Jonsson combined his descriptions o
- Page 187 and 188:
Table II. Solubility product of TiC
- Page 189 and 190:
Ti-C, Z.Metallkd. 86 (1995) 5 319
- Page 191 and 192:
1000 1500 2000 2500 3000 Τ (K) Fig
- Page 193 and 194:
o Oí o 3 4 5 6 7
- Page 195 and 196:
M^øD^ O Kelley(1944) • Kelley an
- Page 197 and 198:
— cale, with Dumitrescu (1997) -
- Page 199 and 200:
€ gfc-π m-, .-π-, π-π .-saa J
- Page 201 and 202:
+graph 0 TiN 0.2 0.4 0.6 X TiC 0.8
- Page 203 and 204:
Binder et al (1992) TiN 1423 K ■
- Page 205 and 206:
0.08 600°C 700°C 800°C 900°C 10
- Page 207 and 208:
[59Sto]: Ä600°C □ 70D°C O8Q0°
- Page 209 and 210:
2000 Cale, with Saunders (1997) —
- Page 211 and 212:
An Experimental Investigation of th
- Page 213 and 214:
An Experimental Investigation of th
- Page 215 and 216:
211 -
- Page 217 and 218:
EXPERIMENTAL INVESTIGATION OF THE C
- Page 219 and 220:
Fig.1 SEM micrographs of CuMgZr
- Page 221 and 222:
■ 888 24 HSM^«" 16—19 3 À I
- Page 223 and 224:
Thermodynamic Evaluations of the Al
- Page 225 and 226:
Fcc_Al aves_C15 ONU ΔΝ12 αΝ13
- Page 227 and 228:
2.2 Assessment The optimisation of
- Page 229 and 230:
0.50 0.45 CulOZr7/ 0. 40 Or ^ 0.3
- Page 231 and 232:
References [71Kri] Kripyakevich, P.
- Page 233 and 234:
Kejun Zeng and Marko Hämäläinen,
- Page 235 and 236:
for detennining phase boundary and
- Page 237 and 238:
Table 2 Al-Fe-Mn results wt%Fe 0.5
- Page 239 and 240:
•00 Γ Ι I I I ~ LIQUID S^ 7iO
- Page 241 and 242:
the observed A2-B2 ordering. This p
- Page 243 and 244:
1473K Ahmed & Flower [94 Ahmi] 0.2
- Page 245 and 246:
900K Paruchuri & Massalski [91Par]
- Page 247 and 248:
BCC_B2#2 TI3RL TIPL BCC B2#2 TIRL
- Page 249 and 250:
0.2 0.3 0.4 0.5 X(LIQ,V) Figure 15
- Page 251 and 252:
1 Introduction and Overview of the
- Page 253 and 254:
at least 95% by Fe, possibly 99%, a
- Page 255 and 256:
8 References 43Phi H W L Phillips,
- Page 257 and 258:
1050 1000 Isopleth, Al - Si - 4 wt
- Page 259 and 260:
Al-Mn-Si 873 K 0.90 Liquid 0.80 0.7
- Page 261 and 262:
A Thermochemical Assessment of Data
- Page 263 and 264:
certainly due to the appearance of
- Page 265 and 266:
Materials Science Centre, November
- Page 267 and 268:
1400 Al-Mn Fig 2 Calculated partial
- Page 269 and 270:
1000 ι AlMn I Ι 950 Liquid E ω
- Page 271 and 272:
Al-Fe-Mn 843 K 0.90 0.80 0.70 0.60
- Page 273 and 274:
AlFeMn section at 2 wt% Mn co
- Page 275:
0.50 0.45 0.40-1 LU £ 0.35 LU 0.30
- Page 279:
European Commission EUR 18171 —CO
- Page 284:
NOTICE TO THE READER Information on