PhD Fekete - SZIE version - 2.2 - Szent István Egyetem
PhD Fekete - SZIE version - 2.2 - Szent István Egyetem
PhD Fekete - SZIE version - 2.2 - Szent István Egyetem

You also want an ePaper? Increase the reach of your titles
YUMPU automatically turns print PDFs into web optimized ePapers that Google loves.
Materials and Methods<br />
All the functions and standard deviation have been summarized in Table 3.6.<br />
FUNCTION OR CONSTANT C1 C2 SD r 2<br />
λ 1 (α) [-] 0.492 0.0024 0.15 0.65<br />
λ 3 (α) [-] 0.86 -0.0022 0.22 0.63<br />
β(α) [°] 26.56 -0.3861 14 0.95<br />
ø(α) [-] 0.567 -0.0026 0.081 0.735<br />
λ t [-] 0.11 0 0.018 -<br />
λ p [-] 0.1475 0 0.043 -<br />
λ f [-] 0.164 0 0.028 -<br />
Table 3.6. Functions* and constants of the analytical-kinetical model<br />
* The following equation is used: f(α) = C1 + C2· α<br />
Where r 2 is the linear correlation coefficient between the original and modelled data values<br />
regarding the λ 1 (α), λ 3 (α), β(α) and ø(α) functions and SD denotes the standard deviation. The<br />
standard deviation and the correlation coefficient are considered normal compared to other<br />
biomechanical measurements [Abe et al., 2010, Eames et al., 1999, Fukagawa et al., 2012].<br />
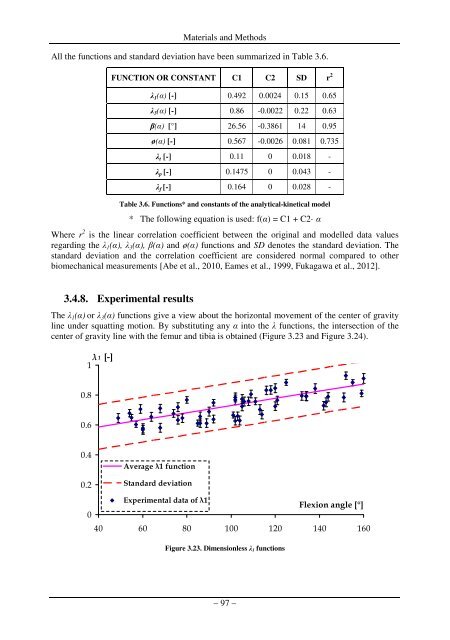
3.4.8. Experimental results<br />
The λ 1 (α) or λ 3 (α) functions give a view about the horizontal movement of the center of gravity<br />
line under squatting motion. By substituting any α into the λ functions, the intersection of the<br />
center of gravity line with the femur and tibia is obtained (Figure 3.23 and Figure 3.24).<br />
λ 1 [-]<br />
1<br />
0.8<br />
0.6<br />
0.4<br />
0.2<br />
Average λ1 function<br />
Standard deviation<br />
Experimental data of λ1<br />
Flexion angle [°]<br />
0<br />
40 60 80 100 120 140 160<br />
Figure 3.23. Dimensionless λ 1 functions<br />
– 97 –