PhD Fekete - SZIE version - 2.2 - Szent István Egyetem
PhD Fekete - SZIE version - 2.2 - Szent István Egyetem
PhD Fekete - SZIE version - 2.2 - Szent István Egyetem

You also want an ePaper? Increase the reach of your titles
YUMPU automatically turns print PDFs into web optimized ePapers that Google loves.
Results<br />
4.<strong>2.2</strong>. Discussion and interpretation of the results<br />
Let us first look at the magnitude and the pattern of the sliding-rolling ratio of the different<br />
prostheses and then at the tibiofemoral contact forces. The calculation of the sliding-rolling is<br />
considered on both sides of the condyles (lateral and medial) and involves the slip in every<br />
direction (spatial).<br />
In the case of the SZIU prototype model (Figure 4.6), both of the lateral and medial sides start<br />
from a positive sliding-rolling ratio of 0.2. The functions gradually increase with occasional<br />
irregularities to 0.42 at the medial side and 0.38 at the lateral side.<br />
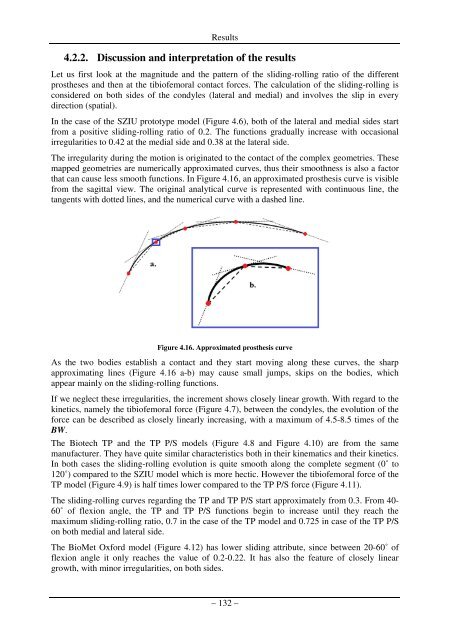
The irregularity during the motion is originated to the contact of the complex geometries. These<br />
mapped geometries are numerically approximated curves, thus their smoothness is also a factor<br />
that can cause less smooth functions. In Figure 4.16, an approximated prosthesis curve is visible<br />
from the sagittal view. The original analytical curve is represented with continuous line, the<br />
tangents with dotted lines, and the numerical curve with a dashed line.<br />
Figure 4.16. Approximated prosthesis curve<br />
As the two bodies establish a contact and they start moving along these curves, the sharp<br />
approximating lines (Figure 4.16 a-b) may cause small jumps, skips on the bodies, which<br />
appear mainly on the sliding-rolling functions.<br />
If we neglect these irregularities, the increment shows closely linear growth. With regard to the<br />
kinetics, namely the tibiofemoral force (Figure 4.7), between the condyles, the evolution of the<br />
force can be described as closely linearly increasing, with a maximum of 4.5-8.5 times of the<br />
BW.<br />
The Biotech TP and the TP P/S models (Figure 4.8 and Figure 4.10) are from the same<br />
manufacturer. They have quite similar characteristics both in their kinematics and their kinetics.<br />
In both cases the sliding-rolling evolution is quite smooth along the complete segment (0˚ to<br />
120˚) compared to the SZIU model which is more hectic. However the tibiofemoral force of the<br />
TP model (Figure 4.9) is half times lower compared to the TP P/S force (Figure 4.11).<br />
The sliding-rolling curves regarding the TP and TP P/S start approximately from 0.3. From 40-<br />
60˚ of flexion angle, the TP and TP P/S functions begin to increase until they reach the<br />
maximum sliding-rolling ratio, 0.7 in the case of the TP model and 0.725 in case of the TP P/S<br />
on both medial and lateral side.<br />
The BioMet Oxford model (Figure 4.12) has lower sliding attribute, since between 20-60˚ of<br />
flexion angle it only reaches the value of 0.2-0.22. It has also the feature of closely linear<br />
growth, with minor irregularities, on both sides.<br />
– 132 –