PhD Fekete - SZIE version - 2.2 - Szent István Egyetem
PhD Fekete - SZIE version - 2.2 - Szent István Egyetem
PhD Fekete - SZIE version - 2.2 - Szent István Egyetem

You also want an ePaper? Increase the reach of your titles
YUMPU automatically turns print PDFs into web optimized ePapers that Google loves.
Results<br />
Among the tested prostheses, this replacement provided the lowest peak sliding-rolling value,<br />
namely 0.56. As for the kinetics, the tibiofemoral force (Figure 4.13) has the same magnitude as<br />
the BioTech TP P/S (Figure 4.11).<br />
While the evolutions of the sliding-rolling functions are somewhat similar regarding the SZIU,<br />
Biotech TP- TP P/S or BioMet Oxford models, the DePuy prosthesis (Figure 4.14) follows a<br />
completely different pattern. The curve is practically constant, with less than 5% of periodic<br />
deviation. The maximum value of the curve is registered at 23˚ of flexion angle at the medial<br />
side where it reaches for a short interval the value of one, which means complete sliding. After<br />
that the function decreases to an average 0.75. The tibiofemoral force (Figure 4.15) is similar to<br />
the BioMet Oxford model (Figure 4.13).<br />
If we compare the magnitude of the lateral and medial sliding-rolling ratio, a slightly higher<br />
percentage of sliding can always be credited to the medial compartment. This difference is quite<br />
visible for the DePuy or SZIU prosthesis while it is less obvious concerning the Biotech or<br />
BioMet models.<br />
This difference was also confirmed by the study of Wilson et al. [Wilson et al., 1998]: from 0˚<br />
to 5˚ of flexion angle the sliding-rolling ratio at the medial side was significantly higher<br />
(approximately 1.5-2 times) compared to the lateral side, between 5˚ and 10˚ was about 1-0.5<br />
times and from 20˚ of flexion angle the difference stays in the range of 5-8%. Since in general<br />
the sliding-rolling ratio is slightly (5-8%) higher on the medial side, the medial results were<br />
taken as reference functions.<br />
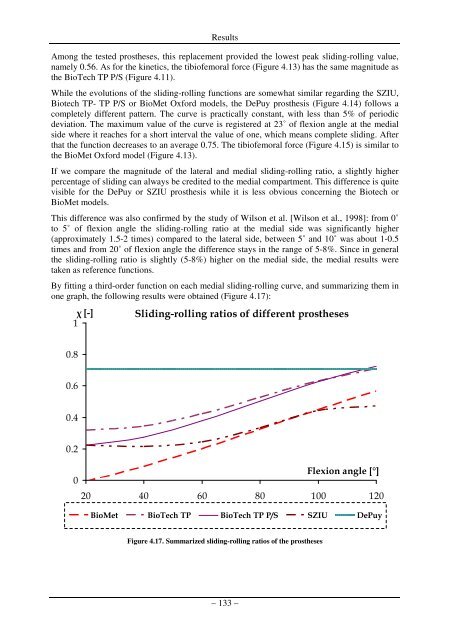
By fitting a third-order function on each medial sliding-rolling curve, and summarizing them in<br />
one graph, the following results were obtained (Figure 4.17):<br />
χ [-]<br />
1<br />
Sliding-rolling ratios of different prostheses<br />
0.8<br />
0.6<br />
0.4<br />
0.2<br />
Flexion angle [°]<br />
0<br />
20 40 60 80 100 120<br />
BioMet BioTech TP BioTech TP P/S SZIU DePuy<br />
Figure 4.17. Summarized sliding-rolling ratios of the prostheses<br />
– 133 –