Modelling Dependence with Copulas - IFOR
Modelling Dependence with Copulas - IFOR
Modelling Dependence with Copulas - IFOR
SHOW LESS

You also want an ePaper? Increase the reach of your titles
YUMPU automatically turns print PDFs into web optimized ePapers that Google loves.
9.2 The Perfect Storm<br />
30<br />
25<br />
Expected Shortfall<br />
20<br />
15<br />
10<br />
5<br />
0.9 0.91 0.92 0.93 0.94 0.95 0.96 0.97 0.98 0.99 1<br />
q<br />
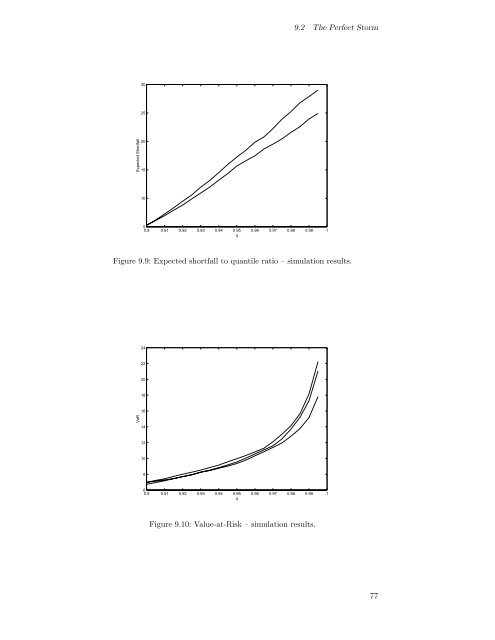
Figure 9.9: Expected shortfall to quantile ratio – simulation results.<br />
24<br />
22<br />
20<br />
18<br />
16<br />
VaR<br />
14<br />
12<br />
10<br />
8<br />
6<br />
0.9 0.91 0.92 0.93 0.94 0.95 0.96 0.97 0.98 0.99 1<br />
q<br />
Figure 9.10: Value-at-Risk – simulation results.<br />
77