

Rural Development Policies and Sustainable Land Use in the ...
Rural Development Policies and Sustainable Land Use in the ...
Rural Development Policies and Sustainable Land Use in the ...

You also want an ePaper? Increase the reach of your titles
YUMPU automatically turns print PDFs into web optimized ePapers that Google loves.
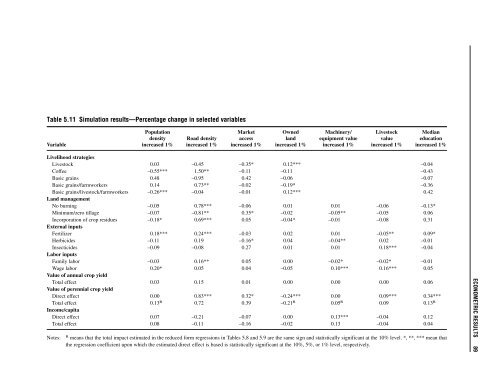
Table 5.11 Simulation results—Percentage change <strong>in</strong> selected variables<br />
Population Market Owned Mach<strong>in</strong>ery/ Livestock Median<br />
density Road density access l<strong>and</strong> equipment value value education<br />
Variable <strong>in</strong>creased 1% <strong>in</strong>creased 1% <strong>in</strong>creased 1% <strong>in</strong>creased 1% <strong>in</strong>creased 1% <strong>in</strong>creased 1% <strong>in</strong>creased 1%<br />
Livelihood strategies<br />
Livestock 0.03 –0.45 –0.35* 0.12*** –0.04<br />
Coffee –0.55*** 1.50** –0.11 –0.11 –0.43<br />
Basic gra<strong>in</strong>s 0.48 –0.95 0.42 –0.06 –0.07<br />
Basic gra<strong>in</strong>s/farmworkers 0.14 0.73** –0.02 –0.19* –0.36<br />
Basic gra<strong>in</strong>s/livestock/farmworkers –0.26*** –0.04 –0.01 0.12*** 0.42<br />
L<strong>and</strong> management<br />
No burn<strong>in</strong>g –0.05 0.78*** –0.06 0.01 0.01 –0.06 –0.13*<br />
M<strong>in</strong>imum/zero tillage –0.07 –0.81** 0.35* –0.02 –0.05** –0.05 0.06<br />
Incorporation of crop residues –0.18* 0.69*** 0.05 –0.04* –0.01 –0.08 0.31<br />
External <strong>in</strong>puts<br />
Fertilizer 0.18*** 0.24*** –0.03 0.02 0.01 –0.05** 0.09*<br />
Herbicides –0.11 0.19 –0.16* 0.04 –0.04** 0.02 –0.01<br />
Insecticides –0.09 –0.08 0.27 0.01 0.01 0.18*** –0.04<br />
Labor <strong>in</strong>puts<br />
Family labor –0.03 0.16** 0.05 0.00 –0.02* –0.02* –0.01<br />
Wage labor 0.20* 0.05 0.04 –0.05 0.10*** 0.16*** 0.05<br />
Value of annual crop yield<br />
Total effect 0.03 0.15 0.01 0.00 0.00 0.00 0.06<br />
Value of perennial crop yield<br />
Direct effect 0.00 0.83*** 0.32* –0.24*** 0.00 0.09*** 0.34***<br />
Total effect 0.13 R 0.72 0.39 –0.21 R 0.05 R 0.09 0.13 R<br />
Income/capita<br />
Direct effect 0.07 –0.21 –0.07 0.00 0.13*** –0.04 0.12<br />
Total effect 0.08 –0.11 –0.16 –0.02 0.13 –0.04 0.04<br />
Notes:<br />
R<br />
means that <strong>the</strong> total impact estimated <strong>in</strong> <strong>the</strong> reduced form regressions <strong>in</strong> Tables 5.8 <strong>and</strong> 5.9 are <strong>the</strong> same sign <strong>and</strong> statistically significant at <strong>the</strong> 10% level. *, **, *** mean that<br />
<strong>the</strong> regression coefficient upon which <strong>the</strong> estimated direct effect is based is statistically significant at <strong>the</strong> 10%, 5%, or 1% level, respectively.<br />
ECONOMETRIC RESULTS 89


