2 CHAPTER 1 Box 1.1 Def<strong>in</strong><strong>in</strong>g “Hillsides,” “Hillside Areas,” <strong>and</strong> “Valleys” Hillsides are def<strong>in</strong>ed as areas with slopes of more than 12 percent (PRONADERS 2000). Hillside areas <strong>in</strong>clude not only hillsides but also flat-floored valleys, 300 to 900 meters <strong>in</strong> elevation, which are scattered throughout <strong>the</strong> <strong>in</strong>terior hillsides. “Valleys” refer ma<strong>in</strong>ly to <strong>the</strong> lowl<strong>and</strong> areas <strong>in</strong> <strong>the</strong> north <strong>and</strong> northwest of <strong>the</strong> country, which are generally considered as high-potential areas for agriculture. In Honduras, hillside areas account for roughly 80 percent of <strong>the</strong> total l<strong>and</strong> area where <strong>the</strong> major economic activity consists of smallholder farm<strong>in</strong>g focus<strong>in</strong>g on production of basic gra<strong>in</strong>s, coffee, <strong>and</strong> livestock. Agricultural potential <strong>in</strong> hillside areas varies with agroecological factors such as elevation, ra<strong>in</strong>fall, <strong>and</strong> soil characteristics. However, compared to areas with lower slope <strong>and</strong> elevation, agricultural options <strong>in</strong> hillside areas are constra<strong>in</strong>ed. Ra<strong>the</strong>r than profit maximization, food security is <strong>the</strong> most important objective of most smallholder households liv<strong>in</strong>g <strong>in</strong> hillside areas. Many hillside areas also have less access to transport <strong>in</strong>frastructure <strong>and</strong> services. not only adversely impact farmers’ <strong>in</strong>comes but also have negative off-farm consequences such as silt<strong>in</strong>g of rivers, result<strong>in</strong>g <strong>in</strong> flood<strong>in</strong>g, reduced water quality, <strong>and</strong> dim<strong>in</strong>ished reservoir capacity. It is not always clear what <strong>in</strong>terventions are needed to foster susta<strong>in</strong>able l<strong>and</strong> use <strong>and</strong> l<strong>and</strong> management practices <strong>in</strong> <strong>the</strong> hillside areas or what <strong>in</strong>terventions will have <strong>the</strong> greatest impact on poverty reduction. The ma<strong>in</strong> factors that drive <strong>the</strong> adoption of soil conservation measures <strong>in</strong> <strong>the</strong> hillside areas <strong>in</strong> Honduras, <strong>and</strong> how <strong>the</strong> provision of tra<strong>in</strong><strong>in</strong>g affects returns to l<strong>and</strong> <strong>and</strong> <strong>in</strong>come, have yet to be clearly <strong>and</strong> conclusively identified. Despite a few localized success stories, 3 <strong>the</strong> rate of adoption of soil conservation measures <strong>in</strong> <strong>the</strong> hillside areas is generally low, <strong>and</strong> identify<strong>in</strong>g <strong>the</strong> technical, <strong>in</strong>stitutional, environmental, <strong>and</strong> socioeconomic factors that condition farmers’ adoption behavior is important for design<strong>in</strong>g promis<strong>in</strong>g policies that could stimulate such practices. Underst<strong>and</strong><strong>in</strong>g <strong>the</strong> complex relationships among growth, poverty, <strong>and</strong> susta<strong>in</strong>able resource use (Vosti <strong>and</strong> Reardon 1997) is crucial to identify<strong>in</strong>g effective strategies <strong>and</strong> policies to improve <strong>the</strong> livelihoods of <strong>the</strong> <strong>in</strong>habitants of <strong>the</strong> rural hillside areas <strong>in</strong> Honduras. This report seeks to improve that underst<strong>and</strong><strong>in</strong>g. Background Honduras has a total population of 6.8 million people <strong>and</strong> a relatively high population growth rate of 2.6 percent per year. Per capita <strong>in</strong>come is US$920 per year (data refer to 2002; see World Bank 2004b). Social <strong>in</strong>dicators such as child malnutrition rate (17 percent), life expectancy at birth (66 years), child mortality rate (32 per 1000 births), <strong>and</strong> literacy rate (less than three quarters of <strong>the</strong> population) are among <strong>the</strong> poorest <strong>in</strong> <strong>the</strong> Lat<strong>in</strong> America <strong>and</strong> Caribbean region. Honduras has acquired Highly Indebted Poor Country (HIPC) status <strong>and</strong> prepared a Poverty Reduction Strategy Paper (PRSP) <strong>in</strong> 2001. Honduras reached <strong>the</strong> so-called completion po<strong>in</strong>t <strong>in</strong> April 2005, which qualifies <strong>the</strong> country for major debt relief <strong>and</strong> 3 See, for example, Deugd (2000) for a description of an agroforestry-based system <strong>in</strong> <strong>the</strong> prov<strong>in</strong>ce of Lempira that comb<strong>in</strong>es productivity-improv<strong>in</strong>g <strong>and</strong> soil conservation components. See also Cárcamo, Alwang, <strong>and</strong> Norton (1994) for descriptions of some successes of <strong>the</strong> former USAID-supported L<strong>and</strong> <strong>Use</strong> <strong>and</strong> Production Enhancement (LUPE) project <strong>in</strong> <strong>the</strong> steep hillsides near Tegucigalpa.
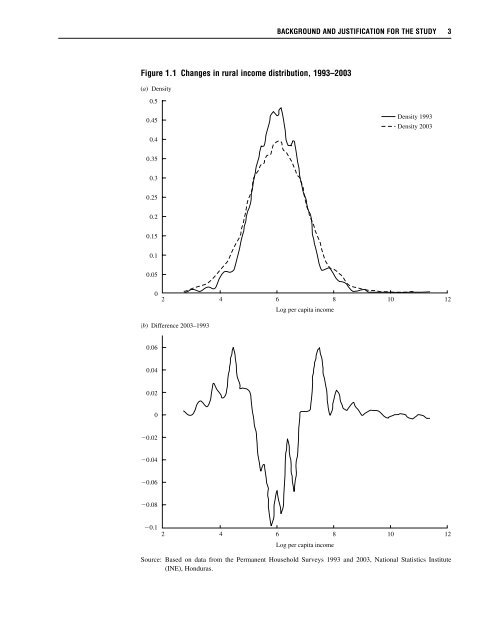
BACKGROUND AND JUSTIFICATION FOR THE STUDY 3 Figure 1.1 Changes <strong>in</strong> rural <strong>in</strong>come distribution, 1993–2003 Source: Based on data from <strong>the</strong> Permanent Household Surveys 1993 <strong>and</strong> 2003, National Statistics Institute (INE), Honduras.
- Page 1 and 2: Rural Development Policies and Sust
- Page 3 and 4: Contents List of Tables iv List of
- Page 5 and 6: TABLES v 5.6 Determinants of extern
- Page 7 and 8: Boxes 1.1 Defining “Hillsides,”
- Page 9 and 10: Acknowledgments The authors acknowl
- Page 11: SUMMARY xi the adoption of sustaina
- Page 16 and 17: 4 CHAPTER 1 will allow Honduras to
- Page 18 and 19: 6 CHAPTER 1 In addition to providin
- Page 20 and 21: 8 CHAPTER 1 econometric analysis to
- Page 22 and 23: 10 CHAPTER 2 1998 and the coffee cr
- Page 24 and 25: 12 CHAPTER 2 Box 2.1 Land Issues in
- Page 26 and 27: 14 CHAPTER 2 Table 2.3 Yield of pri
- Page 28 and 29: 16 CHAPTER 2 Table 2.7 Intersectora
- Page 30 and 31: 18 CHAPTER 2 Figure 2.2 Terms of tr
- Page 32 and 33: CHAPTER 3 Methods and Models In thi
- Page 34 and 35: 22 CHAPTER 3 Figure 3.1 Sustainable
- Page 36 and 37: 24 CHAPTER 3 financial organization
- Page 38 and 39: 26 CHAPTER 3 decide the number of c
- Page 40 and 41: 28 CHAPTER 3 The reduced form versi
- Page 42 and 43: 30 CHAPTER 3 Table 3.1 Variables in
- Page 44 and 45: 32 CHAPTER 3 of years of formal sch
- Page 46 and 47: 34 CHAPTER 3 Key socioeconomic elem
- Page 48 and 49: 36 CHAPTER 3 although we report the
- Page 50 and 51: 38 CHAPTER 4 Table 4.1 Natural capi
- Page 52 and 53: 40 CHAPTER 4 Box 4.1 Remittances Re
- Page 54 and 55: 42 CHAPTER 4 Table 4.6 Access to pu
- Page 56 and 57: 44 CHAPTER 4 strategy (clusters 1 a
- Page 58 and 59: Table 4.8 Mean household net income
- Page 60 and 61: 48 CHAPTER 4 Table 4.9 Summary stat
- Page 62 and 63: 50 CHAPTER 4 Box 4.2 Gender in the
- Page 64 and 65:
52 CHAPTER 5 The socioeconomic expl
- Page 66 and 67:
54 CHAPTER 5 explanatory variables
- Page 68 and 69:
56 CHAPTER 5 technology training) a
- Page 70 and 71:
58 CHAPTER 5 Table 5.3 Determinants
- Page 72 and 73:
60 CHAPTER 5 Table 5.4 Determinants
- Page 74 and 75:
62 CHAPTER 5 the basic grains/lives
- Page 76 and 77:
64 CHAPTER 5 Table 5.5—Continued
- Page 78 and 79:
66 CHAPTER 5 ambiguous effects, dep
- Page 80 and 81:
68 CHAPTER 5 Table 5.6 Determinants
- Page 82 and 83:
70 CHAPTER 5 more livestock focus m
- Page 84 and 85:
72 CHAPTER 5 Table 5.7 Determinants
- Page 86 and 87:
74 CHAPTER 5 Geographic determinant
- Page 88 and 89:
76 CHAPTER 5 Table 5.8—Continued
- Page 90 and 91:
78 CHAPTER 5 Table 5.9—Continued
- Page 92 and 93:
80 CHAPTER 5 when they purchase it
- Page 94 and 95:
82 CHAPTER 5 Table 5.10 Summary of
- Page 96 and 97:
84 CHAPTER 5 able to compensate for
- Page 98 and 99:
86 CHAPTER 5 On the other hand, edu
- Page 100 and 101:
88 CHAPTER 5 and wage labor. Nevert
- Page 102 and 103:
90 CHAPTER 5 productivity. 62 Incre
- Page 104 and 105:
CHAPTER 6 Summary of Findings, Conc
- Page 106 and 107:
94 CHAPTER 6 zero/minimum tillage,
- Page 108 and 109:
96 CHAPTER 6 Develop and promote yi
- Page 110 and 111:
98 REFERENCES Boucher, S., B. Barha
- Page 112 and 113:
100 REFERENCES Hornby, A. S. 1974.
- Page 114 and 115:
102 REFERENCES Pino, H. N., P. Jim