

Rural Development Policies and Sustainable Land Use in the ...
Rural Development Policies and Sustainable Land Use in the ...
Rural Development Policies and Sustainable Land Use in the ...

Create successful ePaper yourself
Turn your PDF publications into a flip-book with our unique Google optimized e-Paper software.
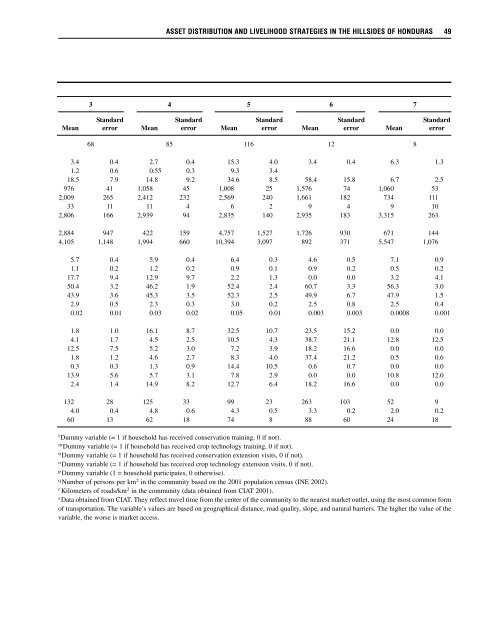
ASSET DISTRIBUTION AND LIVELIHOOD STRATEGIES IN THE HILLSIDES OF HONDURAS 49<br />
3 4 5 6 7<br />
St<strong>and</strong>ard St<strong>and</strong>ard St<strong>and</strong>ard St<strong>and</strong>ard St<strong>and</strong>ard<br />
Mean error Mean error Mean error Mean error Mean error<br />
68 85 116 12 8<br />
3.4 0.4 2.7 0.4 15.3 4.0 3.4 0.4 6.3 1.3<br />
1.2 0.6 0.55 0.3 9.3 3.4<br />
18.5 7.9 14.8 9.2 34.6 8.5 58.4 15.8 6.7 2.5<br />
976 41 1,058 45 1,008 25 1,576 74 1,060 53<br />
2,009 265 2,412 232 2,569 240 1,661 182 734 111<br />
33 11 11 4 6 2 9 4 9 10<br />
2,806 166 2,939 94 2,835 140 2,935 183 3,315 263<br />
2,884 947 422 159 4,757 1,527 1,726 930 671 144<br />
4,105 1,148 1,994 660 10,394 3,097 892 371 5,547 1,076<br />
5.7 0.4 5.9 0.4 6.4 0.3 4.6 0.5 7.1 0.9<br />
1.1 0.2 1.2 0.2 0.9 0.1 0.9 0.2 0.5 0.2<br />
17.7 9.4 12.9 9.7 2.2 1.3 0.0 0.0 3.2 4.1<br />
50.4 3.2 46.2 1.9 52.4 2.4 60.7 3.3 56.3 3.0<br />
43.9 3.6 45.3 3.5 52.3 2.5 49.9 6.7 47.9 1.5<br />
2.9 0.5 2.3 0.3 3.0 0.2 2.5 0.8 2.5 0.4<br />
0.02 0.01 0.03 0.02 0.05 0.01 0.003 0.003 0.0008 0.001<br />
1.8 1.0 16.1 8.7 32.5 10.7 23.5 15.2 0.0 0.0<br />
4.1 1.7 4.5 2.5 10.5 4.3 38.7 21.1 12.8 12.5<br />
12.5 7.5 5.2 3.0 7.2 3.9 18.2 16.6 0.0 0.0<br />
1.8 1.2 4.6 2.7 8.3 4.0 37.4 21.2 0.5 0.6<br />
0.3 0.3 1.3 0.9 14.4 10.5 0.6 0.7 0.0 0.0<br />
13.9 5.6 5.7 3.1 7.8 2.9 0.0 0.0 10.8 12.0<br />
2.4 1.4 14.9 8.2 12.7 6.4 18.2 16.6 0.0 0.0<br />
132 28 125 33 99 23 263 103 52 9<br />
4.0 0.4 4.8 0.6 4.3 0.5 3.3 0.2 2.0 0.2<br />
60 13 62 18 74 8 88 60 24 18<br />
l<br />
Dummy variable (= 1 if household has received conservation tra<strong>in</strong><strong>in</strong>g, 0 if not).<br />
m<br />
Dummy variable (= 1 if household has received crop technology tra<strong>in</strong><strong>in</strong>g, 0 if not).<br />
n<br />
Dummy variable (= 1 if household has received conservation extension visits, 0 if not).<br />
o<br />
Dummy variable (= 1 if household has received crop technology extension visits, 0 if not).<br />
p<br />
Dummy variable (1 = household participates, 0 o<strong>the</strong>rwise).<br />
q<br />
Number of persons per km 2 <strong>in</strong> <strong>the</strong> community based on <strong>the</strong> 2001 population census (INE 2002).<br />
r<br />
Kilometers of roads/km 2 <strong>in</strong> <strong>the</strong> community (data obta<strong>in</strong>ed from CIAT 2001).<br />
s<br />
Data obta<strong>in</strong>ed from CIAT. They reflect travel time from <strong>the</strong> center of <strong>the</strong> community to <strong>the</strong> nearest market outlet, us<strong>in</strong>g <strong>the</strong> most common form<br />
of transportation. The variable’s values are based on geographical distance, road quality, slope, <strong>and</strong> natural barriers. The higher <strong>the</strong> value of <strong>the</strong><br />
variable, <strong>the</strong> worse is market access.


