

Rural Development Policies and Sustainable Land Use in the ...
Rural Development Policies and Sustainable Land Use in the ...
Rural Development Policies and Sustainable Land Use in the ...

Create successful ePaper yourself
Turn your PDF publications into a flip-book with our unique Google optimized e-Paper software.
64 CHAPTER 5<br />
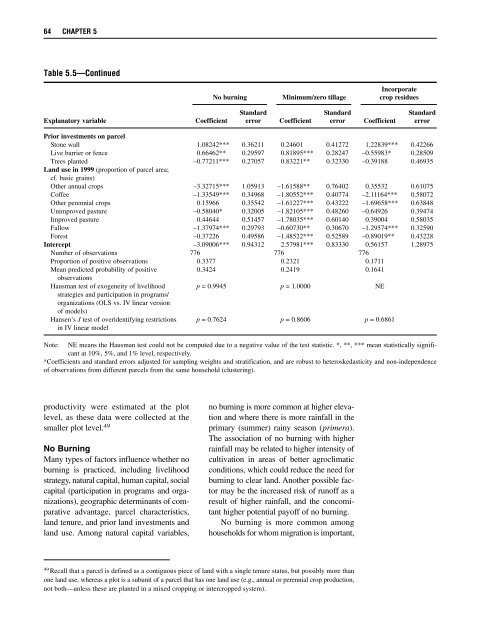
Table 5.5—Cont<strong>in</strong>ued<br />
Incorporate<br />
No burn<strong>in</strong>g M<strong>in</strong>imum/zero tillage crop residues<br />
St<strong>and</strong>ard St<strong>and</strong>ard St<strong>and</strong>ard<br />
Explanatory variable Coefficient error Coefficient error Coefficient error<br />
Prior <strong>in</strong>vestments on parcel<br />
Stone wall 1.08242*** 0.36211 0.24601 0.41272 1.22839*** 0.42266<br />
Live barrier or fence 0.66462** 0.29597 0.81895*** 0.28247 –0.55983* 0.28509<br />
Trees planted –0.77211*** 0.27057 0.83221** 0.32330 –0.39188 0.46935<br />
L<strong>and</strong> use <strong>in</strong> 1999 (proportion of parcel area;<br />
cf. basic gra<strong>in</strong>s)<br />
O<strong>the</strong>r annual crops –3.32715*** 1.05913 –1.61588** 0.76402 0.35532 0.61075<br />
Coffee –1.33549*** 0.34968 –1.80552*** 0.40774 –2.11164*** 0.58072<br />
O<strong>the</strong>r perennial crops 0.15966 0.35542 –1.61227*** 0.43222 –1.69658*** 0.63848<br />
Unimproved pasture –0.58040* 0.32005 –1.82105*** 0.48260 –0.64926 0.39474<br />
Improved pasture 0.44644 0.51457 –1.78035*** 0.60140 0.39004 0.58035<br />
Fallow –1.37974*** 0.29793 –0.60730** 0.30670 –1.29574*** 0.32590<br />
Forest –0.37226 0.49586 –1.48522*** 0.52589 –0.89019** 0.43228<br />
Intercept –3.09006*** 0.94312 2.57981*** 0.83330 0.56157 1.28975<br />
Number of observations 776 776 776<br />
Proportion of positive observations 0.3377 0.2321 0.1711<br />
Mean predicted probability of positive 0.3424 0.2419 0.1641<br />
observations<br />
Hausman test of exogeneity of livelihood p = 0.9945 p = 1.0000 NE<br />
strategies <strong>and</strong> participation <strong>in</strong> programs/<br />
organizations (OLS vs. IV l<strong>in</strong>ear version<br />
of models)<br />
Hansen’s J test of overidentify<strong>in</strong>g restrictions p = 0.7624 p = 0.8606 p = 0.6861<br />
<strong>in</strong> IV l<strong>in</strong>ear model<br />
Note: NE means <strong>the</strong> Hausman test could not be computed due to a negative value of <strong>the</strong> test statistic. *, **, *** mean statistically significant<br />
at 10%, 5%, <strong>and</strong> 1% level, respectively.<br />
a<br />
Coefficients <strong>and</strong> st<strong>and</strong>ard errors adjusted for sampl<strong>in</strong>g weights <strong>and</strong> stratification, <strong>and</strong> are robust to heteroskedasticity <strong>and</strong> non-<strong>in</strong>dependence<br />
of observations from different parcels from <strong>the</strong> same household (cluster<strong>in</strong>g).<br />
productivity were estimated at <strong>the</strong> plot<br />
level, as <strong>the</strong>se data were collected at <strong>the</strong><br />
smaller plot level. 49<br />
No Burn<strong>in</strong>g<br />
Many types of factors <strong>in</strong>fluence whe<strong>the</strong>r no<br />
burn<strong>in</strong>g is practiced, <strong>in</strong>clud<strong>in</strong>g livelihood<br />
strategy, natural capital, human capital, social<br />
capital (participation <strong>in</strong> programs <strong>and</strong> organizations),<br />
geographic determ<strong>in</strong>ants of comparative<br />
advantage, parcel characteristics,<br />
l<strong>and</strong> tenure, <strong>and</strong> prior l<strong>and</strong> <strong>in</strong>vestments <strong>and</strong><br />
l<strong>and</strong> use. Among natural capital variables,<br />
no burn<strong>in</strong>g is more common at higher elevation<br />
<strong>and</strong> where <strong>the</strong>re is more ra<strong>in</strong>fall <strong>in</strong> <strong>the</strong><br />
primary (summer) ra<strong>in</strong>y season (primera).<br />
The association of no burn<strong>in</strong>g with higher<br />
ra<strong>in</strong>fall may be related to higher <strong>in</strong>tensity of<br />
cultivation <strong>in</strong> areas of better agroclimatic<br />
conditions, which could reduce <strong>the</strong> need for<br />
burn<strong>in</strong>g to clear l<strong>and</strong>. Ano<strong>the</strong>r possible factor<br />
may be <strong>the</strong> <strong>in</strong>creased risk of runoff as a<br />
result of higher ra<strong>in</strong>fall, <strong>and</strong> <strong>the</strong> concomitant<br />
higher potential payoff of no burn<strong>in</strong>g.<br />
No burn<strong>in</strong>g is more common among<br />
households for whom migration is important,<br />
49<br />
Recall that a parcel is def<strong>in</strong>ed as a contiguous piece of l<strong>and</strong> with a s<strong>in</strong>gle tenure status, but possibly more than<br />
one l<strong>and</strong> use, whereas a plot is a subunit of a parcel that has one l<strong>and</strong> use (e.g., annual or perennial crop production,<br />
not both—unless <strong>the</strong>se are planted <strong>in</strong> a mixed cropp<strong>in</strong>g or <strong>in</strong>tercropped system).


