

Rural Development Policies and Sustainable Land Use in the ...
Rural Development Policies and Sustainable Land Use in the ...
Rural Development Policies and Sustainable Land Use in the ...

Create successful ePaper yourself
Turn your PDF publications into a flip-book with our unique Google optimized e-Paper software.
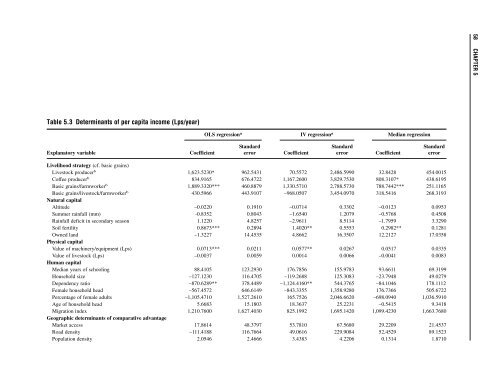
58 CHAPTER 5<br />
Table 5.3 Determ<strong>in</strong>ants of per capita <strong>in</strong>come (Lps/year)<br />
OLS regression a IV regression a Median regression<br />
St<strong>and</strong>ard St<strong>and</strong>ard St<strong>and</strong>ard<br />
Explanatory variable Coefficient error Coefficient error Coefficient error<br />
Livelihood strategy (cf. basic gra<strong>in</strong>s)<br />
Livestock producer b 1,623.5230* 962.5431 70.5572 2,486.5990 32.8428 454.0015<br />
Coffee producer b 834.9165 676.4722 1,167.2600 3,829.7530 808.3107* 438.6195<br />
Basic gra<strong>in</strong>s/farmworker b 1,889.3320*** 460.8879 1,330.5710 2,788.5730 788.7442*** 251.1165<br />
Basic gra<strong>in</strong>s/livestock/farmworker b 430.5966 443.9107 –968.0507 3,454.0970 318.5416 268.3193<br />
Natural capital<br />
Altitude –0.0220 0.1910 –0.0714 0.3302 –0.0123 0.0953<br />
Summer ra<strong>in</strong>fall (mm) -0.8352 0.8043 –1.6540 1.2079 –0.5768 0.4508<br />
Ra<strong>in</strong>fall deficit <strong>in</strong> secondary season 1.1220 4.8257 –2.9611 8.5114 –1.7959 3.3290<br />
Soil fertility 0.8673*** 0.2894 1.4020** 0.5553 0.2982** 0.1281<br />
Owned l<strong>and</strong> –1.3227 14.4535 4.8662 16.3507 12.2127 17.0358<br />
Physical capital<br />
Value of mach<strong>in</strong>ery/equipment (Lps) 0.0713*** 0.0211 0.0577** 0.0267 0.0517 0.0335<br />
Value of livestock (Lps) –0.0037 0.0059 0.0014 0.0066 –0.0041 0.0083<br />
Human capital<br />
Median years of school<strong>in</strong>g 88.4105 123.2930 176.7856 155.9783 93.6611 69.3199<br />
Household size –127.1230 116.4705 –119.2688 125.3083 –23.7948 49.0279<br />
Dependency ratio –870.6289** 378.4489 –1,124.4160** 544.3765 –84.1046 178.1112<br />
Female household head –567.4572 646.6149 –843.3355 1,358.9280 176.7366 505.6722<br />
Percentage of female adults –1,105.4710 1,527.2610 165.7526 2,046.6620 –698.0940 1,036.5910<br />
Age of household head 5.6683 15.1803 18.3637 25.2231 –0.5415 9.3418<br />
Migration <strong>in</strong>dex 1,210.7600 1,627.4030 825.1992 1,695.1420 1,099.4230 1,663.7680<br />
Geographic determ<strong>in</strong>ants of comparative advantage<br />
Market access 17.8614 48.3797 53.7810 67.5680 29.2209 21.4537<br />
Road density –111.4188 116.7664 49.0616 229.9084 52.4529 89.1523<br />
Population density 2.0546 2.4666 3.4383 4.2206 0.1314 1.8710


