Rural Development Policies and Sustainable Land Use in the ...
Rural Development Policies and Sustainable Land Use in the ...
Rural Development Policies and Sustainable Land Use in the ...
You also want an ePaper? Increase the reach of your titles
YUMPU automatically turns print PDFs into web optimized ePapers that Google loves.
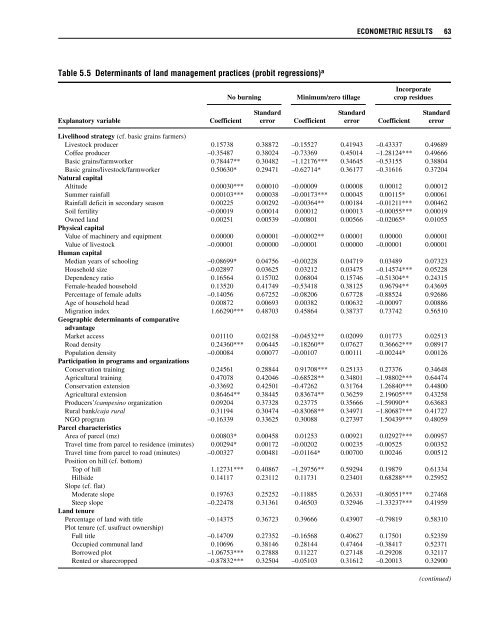
ECONOMETRIC RESULTS 63<br />
Table 5.5 Determ<strong>in</strong>ants of l<strong>and</strong> management practices (probit regressions) a<br />
Incorporate<br />
No burn<strong>in</strong>g M<strong>in</strong>imum/zero tillage crop residues<br />
St<strong>and</strong>ard St<strong>and</strong>ard St<strong>and</strong>ard<br />
Explanatory variable Coefficient error Coefficient error Coefficient error<br />
Livelihood strategy (cf. basic gra<strong>in</strong>s farmers)<br />
Livestock producer 0.15738 0.38872 –0.15527 0.41943 –0.43337 0.49689<br />
Coffee producer –0.35487 0.38024 –0.73369 0.45014 –1.28124*** 0.49666<br />
Basic gra<strong>in</strong>s/farmworker 0.78447** 0.30482 –1.12176*** 0.34645 –0.53155 0.38804<br />
Basic gra<strong>in</strong>s/livestock/farmworker 0.50630* 0.29471 –0.62714* 0.36177 –0.31616 0.37204<br />
Natural capital<br />
Altitude 0.00030*** 0.00010 –0.00009 0.00008 0.00012 0.00012<br />
Summer ra<strong>in</strong>fall 0.00103*** 0.00038 –0.00173*** 0.00045 0.00115* 0.00061<br />
Ra<strong>in</strong>fall deficit <strong>in</strong> secondary season 0.00225 0.00292 –0.00364** 0.00184 –0.01211*** 0.00462<br />
Soil fertility –0.00019 0.00014 0.00012 0.00013 –0.00055*** 0.00019<br />
Owned l<strong>and</strong> 0.00251 0.00539 –0.00801 0.00566 –0.02065* 0.01055<br />
Physical capital<br />
Value of mach<strong>in</strong>ery <strong>and</strong> equipment 0.00000 0.00001 –0.00002** 0.00001 0.00000 0.00001<br />
Value of livestock –0.00001 0.00000 –0.00001 0.00000 –0.00001 0.00001<br />
Human capital<br />
Median years of school<strong>in</strong>g –0.08699* 0.04756 –0.00228 0.04719 0.03489 0.07323<br />
Household size –0.02897 0.03625 0.03212 0.03475 –0.14574*** 0.05228<br />
Dependency ratio 0.16564 0.15702 0.06804 0.15746 –0.51304** 0.24315<br />
Female-headed household 0.13520 0.41749 –0.53418 0.38125 0.96794** 0.43695<br />
Percentage of female adults –0.14056 0.67252 –0.08206 0.67728 –0.88524 0.92686<br />
Age of household head 0.00872 0.00693 0.00382 0.00632 –0.00097 0.00886<br />
Migration <strong>in</strong>dex 1.66290*** 0.48703 0.45864 0.38737 0.73742 0.56510<br />
Geographic determ<strong>in</strong>ants of comparative<br />
advantage<br />
Market access 0.01110 0.02158 –0.04532** 0.02099 0.01773 0.02513<br />
Road density 0.24360*** 0.06445 –0.18260** 0.07627 0.36662*** 0.08917<br />
Population density –0.00084 0.00077 –0.00107 0.00111 –0.00244* 0.00126<br />
Participation <strong>in</strong> programs <strong>and</strong> organizations<br />
Conservation tra<strong>in</strong><strong>in</strong>g 0.24561 0.28844 0.91708*** 0.25133 0.27376 0.34648<br />
Agricultural tra<strong>in</strong><strong>in</strong>g 0.47078 0.42046 –0.68528** 0.34801 –1.98802*** 0.64474<br />
Conservation extension -0.33692 0.42501 –0.47262 0.31764 1.26840*** 0.44800<br />
Agricultural extension 0.86464** 0.38445 0.83674** 0.36259 2.19605*** 0.43258<br />
Producers’/campes<strong>in</strong>o organization 0.09204 0.37328 0.23775 0.35666 –1.59090** 0.63683<br />
<strong>Rural</strong> bank/caja rural 0.31194 0.30474 –0.83068** 0.34971 –1.80687*** 0.41727<br />
NGO program –0.16339 0.33625 0.30088 0.27397 1.50439*** 0.48059<br />
Parcel characteristics<br />
Area of parcel (mz) 0.00803* 0.00458 0.01253 0.00921 0.02927*** 0.00957<br />
Travel time from parcel to residence (m<strong>in</strong>utes) 0.00294* 0.00172 –0.00202 0.00235 –0.00525 0.00352<br />
Travel time from parcel to road (m<strong>in</strong>utes) –0.00327 0.00481 –0.01164* 0.00700 0.00246 0.00512<br />
Position on hill (cf. bottom)<br />
Top of hill 1.12731*** 0.40867 –1.29756** 0.59294 0.19879 0.61334<br />
Hillside 0.14117 0.23112 0.11731 0.23401 0.68288*** 0.25952<br />
Slope (cf. flat)<br />
Moderate slope 0.19763 0.25252 –0.11885 0.26331 –0.80551*** 0.27468<br />
Steep slope –0.22478 0.31361 0.46503 0.32946 –1.33237*** 0.41959<br />
L<strong>and</strong> tenure<br />
Percentage of l<strong>and</strong> with title –0.14375 0.36723 0.39666 0.43907 –0.79819 0.58310<br />
Plot tenure (cf. usufruct ownership)<br />
Full title –0.14709 0.27352 –0.16568 0.40627 0.17501 0.52359<br />
Occupied communal l<strong>and</strong> 0.10696 0.38146 0.28144 0.47464 –0.38417 0.52371<br />
Borrowed plot –1.06753*** 0.27888 0.11227 0.27148 –0.29208 0.32117<br />
Rented or sharecropped –0.87832*** 0.32504 –0.05103 0.31612 –0.20013 0.32900<br />
(cont<strong>in</strong>ued)


