

Rural Development Policies and Sustainable Land Use in the ...
Rural Development Policies and Sustainable Land Use in the ...
Rural Development Policies and Sustainable Land Use in the ...

You also want an ePaper? Increase the reach of your titles
YUMPU automatically turns print PDFs into web optimized ePapers that Google loves.
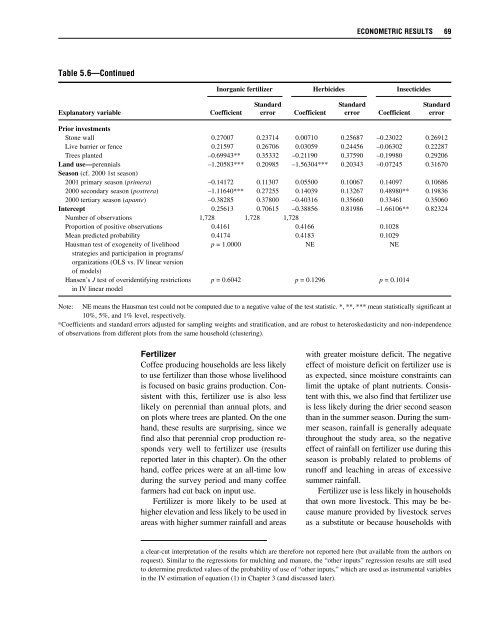
ECONOMETRIC RESULTS 69<br />
Table 5.6—Cont<strong>in</strong>ued<br />
Inorganic fertilizer Herbicides Insecticides<br />
St<strong>and</strong>ard St<strong>and</strong>ard St<strong>and</strong>ard<br />
Explanatory variable Coefficient error Coefficient error Coefficient error<br />
Prior <strong>in</strong>vestments<br />
Stone wall 0.27007 0.23714 0.00710 0.25687 –0.23022 0.26912<br />
Live barrier or fence 0.21597 0.26706 0.03059 0.24456 –0.06302 0.22287<br />
Trees planted –0.69943** 0.35332 –0.21190 0.37590 –0.19980 0.29206<br />
L<strong>and</strong> use—perennials –1.20583*** 0.20985 –1.56304*** 0.20343 –0.07245 0.31670<br />
Season (cf. 2000 1st season)<br />
2001 primary season (primera) –0.14172 0.11307 0.05500 0.10067 0.14097 0.10686<br />
2000 secondary season (postrera) –1.11640*** 0.27255 0.14039 0.13267 0.48980** 0.19836<br />
2000 tertiary season (apante) –0.38285 0.37800 –0.40316 0.35660 0.33461 0.35060<br />
Intercept 0.25613 0.70615 –0.38856 0.81986 –1.66106** 0.82324<br />
Number of observations 1,728 1,728 1,728<br />
Proportion of positive observations 0.4161 0.4166 0.1028<br />
Mean predicted probability 0.4174 0.4183 0.1029<br />
Hausman test of exogeneity of livelihood p = 1.0000 NE NE<br />
strategies <strong>and</strong> participation <strong>in</strong> programs/<br />
organizations (OLS vs. IV l<strong>in</strong>ear version<br />
of models)<br />
Hansen’s J test of overidentify<strong>in</strong>g restrictions p = 0.6042 p = 0.1296 p = 0.1014<br />
<strong>in</strong> IV l<strong>in</strong>ear model<br />
Note: NE means <strong>the</strong> Hausman test could not be computed due to a negative value of <strong>the</strong> test statistic. *, **, *** mean statistically significant at<br />
10%, 5%, <strong>and</strong> 1% level, respectively.<br />
a<br />
Coefficients <strong>and</strong> st<strong>and</strong>ard errors adjusted for sampl<strong>in</strong>g weights <strong>and</strong> stratification, <strong>and</strong> are robust to heteroskedasticity <strong>and</strong> non-<strong>in</strong>dependence<br />
of observations from different plots from <strong>the</strong> same household (cluster<strong>in</strong>g).<br />
Fertilizer<br />
Coffee produc<strong>in</strong>g households are less likely<br />
to use fertilizer than those whose livelihood<br />
is focused on basic gra<strong>in</strong>s production. Consistent<br />
with this, fertilizer use is also less<br />
likely on perennial than annual plots, <strong>and</strong><br />
on plots where trees are planted. On <strong>the</strong> one<br />
h<strong>and</strong>, <strong>the</strong>se results are surpris<strong>in</strong>g, s<strong>in</strong>ce we<br />
f<strong>in</strong>d also that perennial crop production responds<br />
very well to fertilizer use (results<br />
reported later <strong>in</strong> this chapter). On <strong>the</strong> o<strong>the</strong>r<br />
h<strong>and</strong>, coffee prices were at an all-time low<br />
dur<strong>in</strong>g <strong>the</strong> survey period <strong>and</strong> many coffee<br />
farmers had cut back on <strong>in</strong>put use.<br />
Fertilizer is more likely to be used at<br />
higher elevation <strong>and</strong> less likely to be used <strong>in</strong><br />
areas with higher summer ra<strong>in</strong>fall <strong>and</strong> areas<br />
with greater moisture deficit. The negative<br />
effect of moisture deficit on fertilizer use is<br />
as expected, s<strong>in</strong>ce moisture constra<strong>in</strong>ts can<br />
limit <strong>the</strong> uptake of plant nutrients. Consistent<br />
with this, we also f<strong>in</strong>d that fertilizer use<br />
is less likely dur<strong>in</strong>g <strong>the</strong> drier second season<br />
than <strong>in</strong> <strong>the</strong> summer season. Dur<strong>in</strong>g <strong>the</strong> summer<br />
season, ra<strong>in</strong>fall is generally adequate<br />
throughout <strong>the</strong> study area, so <strong>the</strong> negative<br />
effect of ra<strong>in</strong>fall on fertilizer use dur<strong>in</strong>g this<br />
season is probably related to problems of<br />
runoff <strong>and</strong> leach<strong>in</strong>g <strong>in</strong> areas of excessive<br />
summer ra<strong>in</strong>fall.<br />
Fertilizer use is less likely <strong>in</strong> households<br />
that own more livestock. This may be because<br />
manure provided by livestock serves<br />
as a substitute or because households with<br />
a clear-cut <strong>in</strong>terpretation of <strong>the</strong> results which are <strong>the</strong>refore not reported here (but available from <strong>the</strong> authors on<br />
request). Similar to <strong>the</strong> regressions for mulch<strong>in</strong>g <strong>and</strong> manure, <strong>the</strong> “o<strong>the</strong>r <strong>in</strong>puts” regression results are still used<br />
to determ<strong>in</strong>e predicted values of <strong>the</strong> probability of use of “o<strong>the</strong>r <strong>in</strong>puts,” which are used as <strong>in</strong>strumental variables<br />
<strong>in</strong> <strong>the</strong> IV estimation of equation (1) <strong>in</strong> Chapter 3 (<strong>and</strong> discussed later).


