

Rural Development Policies and Sustainable Land Use in the ...
Rural Development Policies and Sustainable Land Use in the ...
Rural Development Policies and Sustainable Land Use in the ...

You also want an ePaper? Increase the reach of your titles
YUMPU automatically turns print PDFs into web optimized ePapers that Google loves.
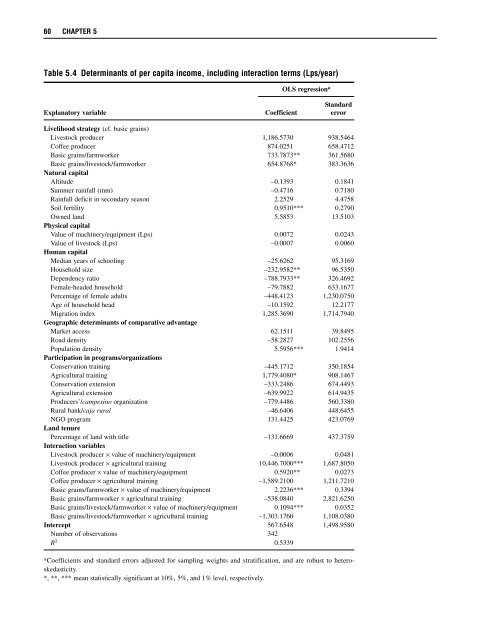
60 CHAPTER 5<br />
Table 5.4 Determ<strong>in</strong>ants of per capita <strong>in</strong>come, <strong>in</strong>clud<strong>in</strong>g <strong>in</strong>teraction terms (Lps/year)<br />
OLS regression a<br />
St<strong>and</strong>ard<br />
Explanatory variable Coefficient error<br />
Livelihood strategy (cf. basic gra<strong>in</strong>s)<br />
Livestock producer 1,186.5730 938.5464<br />
Coffee producer 874.0251 658.4712<br />
Basic gra<strong>in</strong>s/farmworker 733.7873** 361.5680<br />
Basic gra<strong>in</strong>s/livestock/farmworker 654.8768* 383.3636<br />
Natural capital<br />
Altitude –0.1393 0.1841<br />
Summer ra<strong>in</strong>fall (mm) –0.4716 0.7180<br />
Ra<strong>in</strong>fall deficit <strong>in</strong> secondary season 2.2529 4.4758<br />
Soil fertility 0.9510*** 0.2790<br />
Owned l<strong>and</strong> 5.5853 13.5103<br />
Physical capital<br />
Value of mach<strong>in</strong>ery/equipment (Lps) 0.0072 0.0243<br />
Value of livestock (Lps) –0.0007 0.0060<br />
Human capital<br />
Median years of school<strong>in</strong>g –25.6262 95.3169<br />
Household size –232.9582** 96.5350<br />
Dependency ratio –788.7933** 326.4692<br />
Female-headed household –79.7882 633.1677<br />
Percentage of female adults –448.4123 1,230.0750<br />
Age of household head –10.1592 12.2177<br />
Migration <strong>in</strong>dex 1,285.3690 1,714.7940<br />
Geographic determ<strong>in</strong>ants of comparative advantage<br />
Market access 62.1511 39.8495<br />
Road density –58.2827 102.2556<br />
Population density 5.5956*** 1.9414<br />
Participation <strong>in</strong> programs/organizations<br />
Conservation tra<strong>in</strong><strong>in</strong>g –445.1712 350.1854<br />
Agricultural tra<strong>in</strong><strong>in</strong>g 1,779.4080* 908.1467<br />
Conservation extension –333.2486 674.4493<br />
Agricultural extension –639.9922 614.9435<br />
Producers’/campes<strong>in</strong>o organization –779.4486 560.3380<br />
<strong>Rural</strong> bank/caja rural –46.6406 448.6455<br />
NGO program 131.4425 423.0769<br />
L<strong>and</strong> tenure<br />
Percentage of l<strong>and</strong> with title –131.6669 437.3759<br />
Interaction variables<br />
Livestock producer × value of mach<strong>in</strong>ery/equipment –0.0006 0.0481<br />
Livestock producer × agricultural tra<strong>in</strong><strong>in</strong>g 10,446.7000*** 1,687.8050<br />
Coffee producer × value of mach<strong>in</strong>ery/equipment 0.5920** 0.0273<br />
Coffee producer × agricultural tra<strong>in</strong><strong>in</strong>g –1,589.2100 1,211.7210<br />
Basic gra<strong>in</strong>s/farmworker × value of mach<strong>in</strong>ery/equipment 2.2236*** 0.3394<br />
Basic gra<strong>in</strong>s/farmworker × agricultural tra<strong>in</strong><strong>in</strong>g –538.0840 2,821.6250<br />
Basic gra<strong>in</strong>s/livestock/farmworker × value of mach<strong>in</strong>ery/equipment 0.1094*** 0.0352<br />
Basic gra<strong>in</strong>s/livestock/farmworker × agricultural tra<strong>in</strong><strong>in</strong>g –1,303.1760 1,108.0380<br />
Intercept 567.6548 1,498.9580<br />
Number of observations 342<br />
R 2 0.5339<br />
a<br />
Coefficients <strong>and</strong> st<strong>and</strong>ard errors adjusted for sampl<strong>in</strong>g weights <strong>and</strong> stratification, <strong>and</strong> are robust to heteroskedasticity.<br />
*, **, *** mean statistically significant at 10%, 5%, <strong>and</strong> 1% level, respectively.


