

How to Kill a Black Swan Remy Briand and David Owyong ...
How to Kill a Black Swan Remy Briand and David Owyong ...
How to Kill a Black Swan Remy Briand and David Owyong ...

Create successful ePaper yourself
Turn your PDF publications into a flip-book with our unique Google optimized e-Paper software.
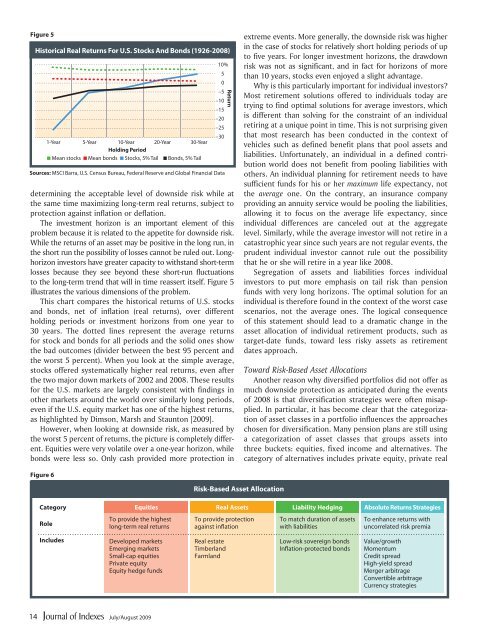
Figure 5<br />
His<strong>to</strong>rical Real Returns For U.S. S<strong>to</strong>cks And Bonds (1926-2008)<br />
1-Year 5-Year 10-Year 20-Year 30-Year<br />
Holding Period<br />
■ Mean s<strong>to</strong>cks ■ Mean bonds ■ S<strong>to</strong>cks, 5% Tail ■ Bonds, 5% Tail<br />
10%<br />
5<br />
0<br />
–5<br />
–10<br />
–15<br />
–20<br />
–25<br />
–30<br />
Sources: MSCI Barra, U.S. Census Bureau, Federal Reserve <strong>and</strong> Global Financial Data<br />
determining the acceptable level of downside risk while at<br />
the same time maximizing long-term real returns, subject <strong>to</strong><br />
protection against inflation or deflation.<br />
The investment horizon is an important element of this<br />
problem because it is related <strong>to</strong> the appetite for downside risk.<br />
While the returns of an asset may be positive in the long run, in<br />
the short run the possibility of losses cannot be ruled out. Longhorizon<br />
inves<strong>to</strong>rs have greater capacity <strong>to</strong> withst<strong>and</strong> short-term<br />
losses because they see beyond these short-run fluctuations<br />
<strong>to</strong> the long-term trend that will in time reassert itself. Figure 5<br />
illustrates the various dimensions of the problem.<br />
This chart compares the his<strong>to</strong>rical returns of U.S. s<strong>to</strong>cks<br />
<strong>and</strong> bonds, net of inflation (real returns), over different<br />
holding periods or investment horizons from one year <strong>to</strong><br />
30 years. The dotted lines represent the average returns<br />
for s<strong>to</strong>ck <strong>and</strong> bonds for all periods <strong>and</strong> the solid ones show<br />
the bad outcomes (divider between the best 95 percent <strong>and</strong><br />
the worst 5 percent). When you look at the simple average,<br />
s<strong>to</strong>cks offered systematically higher real returns, even after<br />
the two major down markets of 2002 <strong>and</strong> 2008. These results<br />
for the U.S. markets are largely consistent with findings in<br />
other markets around the world over similarly long periods,<br />
even if the U.S. equity market has one of the highest returns,<br />
as highlighted by Dimson, Marsh <strong>and</strong> Staun<strong>to</strong>n [2009].<br />
<strong>How</strong>ever, when looking at downside risk, as measured by<br />
the worst 5 percent of returns, the picture is completely different.<br />
Equities were very volatile over a one-year horizon, while<br />
bonds were less so. Only cash provided more protection in<br />
Return<br />
extreme events. More generally, the downside risk was higher<br />
in the case of s<strong>to</strong>cks for relatively short holding periods of up<br />
<strong>to</strong> five years. For longer investment horizons, the drawdown<br />
risk was not as significant, <strong>and</strong> in fact for horizons of more<br />
than 10 years, s<strong>to</strong>cks even enjoyed a slight advantage.<br />
Why is this particularly important for individual inves<strong>to</strong>rs?<br />
Most retirement solutions offered <strong>to</strong> individuals <strong>to</strong>day are<br />
trying <strong>to</strong> find optimal solutions for average inves<strong>to</strong>rs, which<br />
is different than solving for the constraint of an individual<br />
retiring at a unique point in time. This is not surprising given<br />
that most research has been conducted in the context of<br />
vehicles such as defined benefit plans that pool assets <strong>and</strong><br />
liabilities. Unfortunately, an individual in a defined contribution<br />
world does not benefit from pooling liabilities with<br />
others. An individual planning for retirement needs <strong>to</strong> have<br />
sufficient funds for his or her maximum life expectancy, not<br />
the average one. On the contrary, an insurance company<br />
providing an annuity service would be pooling the liabilities,<br />
allowing it <strong>to</strong> focus on the average life expectancy, since<br />
individual differences are canceled out at the aggregate<br />
level. Similarly, while the average inves<strong>to</strong>r will not retire in a<br />
catastrophic year since such years are not regular events, the<br />
prudent individual inves<strong>to</strong>r cannot rule out the possibility<br />
that he or she will retire in a year like 2008.<br />
Segregation of assets <strong>and</strong> liabilities forces individual<br />
inves<strong>to</strong>rs <strong>to</strong> put more emphasis on tail risk than pension<br />
funds with very long horizons. The optimal solution for an<br />
individual is therefore found in the context of the worst case<br />
scenarios, not the average ones. The logical consequence<br />
of this statement should lead <strong>to</strong> a dramatic change in the<br />
asset allocation of individual retirement products, such as<br />
target-date funds, <strong>to</strong>ward less risky assets as retirement<br />
dates approach.<br />
Toward Risk-Based Asset Allocations<br />
Another reason why diversified portfolios did not offer as<br />
much downside protection as anticipated during the events<br />
of 2008 is that diversification strategies were often misapplied.<br />
In particular, it has become clear that the categorization<br />
of asset classes in a portfolio influences the approaches<br />
chosen for diversification. Many pension plans are still using<br />
a categorization of asset classes that groups assets in<strong>to</strong><br />
three buckets: equities, fixed income <strong>and</strong> alternatives. The<br />
category of alternatives includes private equity, private real<br />
Figure 6<br />
Risk-Based Asset Allocation<br />
Category<br />
Role<br />
Equities<br />
To provide the highest<br />
long-term real returns<br />
Real Assets Liability Hedging Absolute Returns Strategies<br />
To provide protection<br />
against inflation<br />
To match duration of assets<br />
with liabilities<br />
To enhance returns with<br />
uncorrelated risk premia<br />
Includes<br />
Developed markets<br />
Emerging markets<br />
Small-cap equities<br />
Private equity<br />
Equity hedge funds<br />
Real estate<br />
Timberl<strong>and</strong><br />
Farml<strong>and</strong><br />
Low-risk sovereign bonds<br />
Inflation-protected bonds<br />
Value/growth<br />
Momentum<br />
Credit spread<br />
High-yield spread<br />
Merger arbitrage<br />
Convertible arbitrage<br />
Currency strategies<br />
14<br />
July/August 2009


