How to Kill a Black Swan Remy Briand and David Owyong ...
How to Kill a Black Swan Remy Briand and David Owyong ...
How to Kill a Black Swan Remy Briand and David Owyong ...
You also want an ePaper? Increase the reach of your titles
YUMPU automatically turns print PDFs into web optimized ePapers that Google loves.
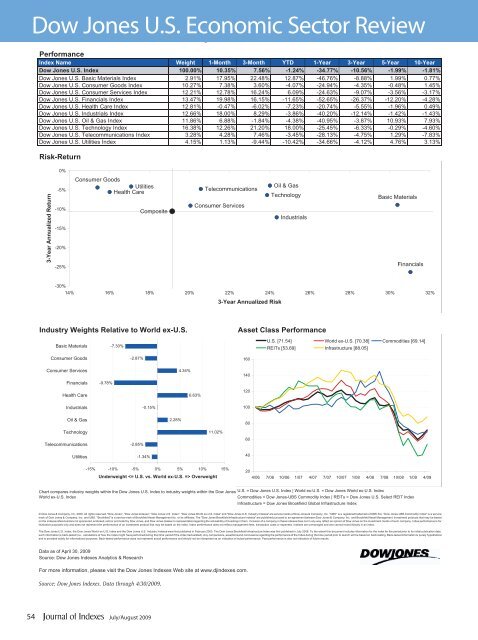
Dow Jones U.S. Economic Sec<strong>to</strong>r Review<br />
Dow Jones U.S. Industry Indexes<br />
Performance<br />
Index Name Weight 1-Month 3-Month YTD 1-Year 3-Year 5-Year 10-Year<br />
Dow Jones U.S. Index 100.00% 10.35% 7.56% -1.24% -34.77% -10.56% -1.99% -1.81%<br />
Dow Jones U.S. Basic Materials Index 2.91% 17.95% 22.48% 12.87% -46.76% -8.88% 1.99% 0.77%<br />
Dow Jones U.S. Consumer Goods Index 10.27% 7.38% 3.60% -4.07% -24.94% -4.35% -0.48% 1.45%<br />
Dow Jones U.S. Consumer Services Index 12.21% 12.78% 16.24% 6.09% -24.63% -9.07% -3.56% -3.17%<br />
Dow Jones U.S. Financials Index 13.47% 19.98% 16.15% -11.65% -52.65% -26.37% -12.20% -4.28%<br />
Dow Jones U.S. Health Care Index 12.81% -0.47% -6.02% -7.23% -20.74% -5.55% -1.96% 0.49%<br />
Dow Jones U.S. Industrials Index 12.66% 18.00% 8.29% -3.86% -40.20% -12.14% -1.42% -1.43%<br />
Dow Jones U.S. Oil & Gas Index 11.86% 6.88% -1.84% -4.38% -40.95% -3.87% 10.93% 7.93%<br />
Dow Jones U.S. Technology Index 16.38% 12.26% 21.20% 18.00% -25.45% -6.33% -0.29% -4.60%<br />
Dow Jones U.S. Telecommunications Index 3.28% 4.28% 7.46% -3.45% -28.13% -4.75% 1.29% -7.83%<br />
Dow Jones U.S. Utilities Index 4.15% 1.13% -9.44% -10.42% -34.66% -4.12% 4.76% 3.13%<br />
Risk-Return<br />
0%<br />
3-Year Annualized Return<br />
-5%<br />
-10%<br />
-15%<br />
-20%<br />
-25%<br />
Consumer Goods<br />
Utilities<br />
Health Care<br />
Composite<br />
Telecommunications<br />
Consumer Services<br />
Oil & Gas<br />
Technology<br />
Industrials<br />
Basic Materials<br />
Financials<br />
-30%<br />
14% 16% 18% 20% 22% 24% 26% 28% 30% 32%<br />
3-Year Annualized Risk<br />
Industry Weights Relative <strong>to</strong> World ex-U.S.<br />
Basic Materials<br />
-7.30%<br />
Asset Class Performance<br />
U.S. [71.54] World ex-U.S. [70.38] Commodities [69.14]<br />
REITs [53.69] Infrastructure [88.05]<br />
Consumer Goods<br />
-2.87%<br />
160<br />
Consumer Services<br />
4.34%<br />
140<br />
Financials<br />
-9.78%<br />
Health Care<br />
6.63%<br />
120<br />
Industrials<br />
-0.15%<br />
100<br />
Oil & Gas<br />
2.28%<br />
80<br />
Technology<br />
11.02%<br />
Telecommunications<br />
-2.85%<br />
60<br />
Utilities<br />
-1.34%<br />
40<br />
-15% -10% -5% 0% 5% 10% 15%<br />
Underweight Overweight<br />
20<br />
4/06 7/06 10/06 1/07 4/07 7/07 10/07 1/08 4/08 7/08 10/08 1/09 4/09<br />
Chart compares industry weights within the Dow Jones U.S. Index <strong>to</strong> industry weights within the Dow Jones U.S. = Dow Jones U.S. Index | World ex-U.S. = Dow Jones World ex-U.S. Index<br />
World ex-U.S. Index<br />
Commodities = Dow Jones-UBS Commodity Index | REITs = Dow Jones U.S. Select REIT Index<br />
Infrastructure = Dow Jones Brookfield Global Infrastructure Index<br />
© Dow Jones & Company, Inc. 2009. All rights reserved."Dow Jones", "Dow Jones Indexes", "Dow Jones U.S. Index", "Dow Jones World ex-U.S. Index" <strong>and</strong> "Dow Jones U.S. Industry Indexes" are service marks of Dow Jones & Company, Inc. "UBS" is a registered trademark of UBS AG. "Dow Jones-UBS Commodity Index" is a service<br />
mark of Dow Jones & Company, Inc. <strong>and</strong> UBS. "Brookfield" is a service mark of Brookfield Asset Management Inc. or its affiliates. The "Dow Jones Brookfield Infrastructure Indexes" are published pursuant <strong>to</strong> an agreement between Dow Jones & Company, Inc. <strong>and</strong> Brookfield Asset Management. Investment products that may be based<br />
on the indexes referencedare not sponsored,endorsed, sold or promoted by Dow Jones, <strong>and</strong> Dow Jones makes no representationregarding the advisability of investing in them. Inclusion of a company in these indexes does not in any way reflect an opinion of Dow Jones on the investment merits of such company. Index performance is for<br />
illustrative purposes only <strong>and</strong> does not represent the performance of an investment product that may be based on the index. Index performance does not reflect management fees, transaction costs or expenses. Indexes are unmanaged <strong>and</strong> one cannot invest directly in an index.<br />
The Dow Jones U.S. Index, the Dow Jones World ex-U.S. Index <strong>and</strong> the Dow Jones U.S. Industry Indexes were first published in February 2000. The Dow Jones Brookfield Infrastructure Index was first published in July 2008. To the extent this document includes information for the index for the period prior <strong>to</strong> its initial publication date,<br />
such information is back-tested (i.e., calculations of how the index might have performed during that time period if the index had existed). Any comparisons, assertions<strong>and</strong> conclusions regarding the performance of the Index during the time period prior <strong>to</strong> launch will be based on back-testing. Back-tested information is purely hypothetical<br />
<strong>and</strong> is provided solely for informational purposes. Back-tested performance does not represent actual performance <strong>and</strong> should not be interpreted as an indication of actual performance. Past performance is also not indicative of future results.<br />
Data as of April 30, 2009<br />
Source: Dow Jones Indexes Analytics & Research<br />
For more information, please visit the Dow Jones Indexes Web site at www.djindexes.com.<br />
Source: Dow Jones Indexes. Data through 4/30/2009.<br />
Source:<br />
54<br />
July/August 2009


