The Group KD Group and KD Group dd
The Group KD Group and KD Group dd
The Group KD Group and KD Group dd

You also want an ePaper? Increase the reach of your titles
YUMPU automatically turns print PDFs into web optimized ePapers that Google loves.
<strong>The</strong> <strong>KD</strong> <strong>Group</strong> Annual Report 2009<br />
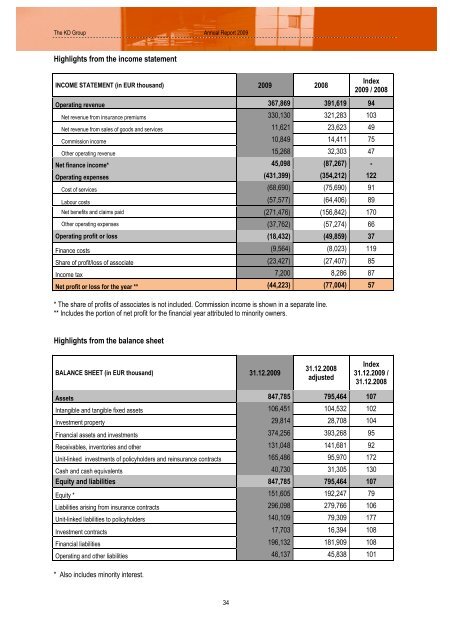
Highlights from the income statement<br />
INCOME STATEMENT (in EUR thous<strong>and</strong>) 2009 2008<br />
Index<br />
2009 / 2008<br />
Operating revenue 367,869 391,619 94<br />
Net revenue from insurance premiums 330,130 321,283 103<br />
Net revenue from sales of goods <strong>and</strong> services 11,621 23,623 49<br />
Commission income 10,849 14,411 75<br />
Other operating revenue 15,268 32,303 47<br />
Net finance income* 45,098 (87,267) -<br />
Operating expenses (431,399) (354,212) 122<br />
Cost of services (68,690) (75,690) 91<br />
Labour costs (57,577) (64,406) 89<br />
Net benefits <strong>and</strong> claims paid (271,476) (156,842) 170<br />
Other operating expenses (37,762) (57,274) 66<br />
Operating profit or loss (18,432) (49,859) 37<br />
Finance costs (9,564) (8,023) 119<br />
Share of profit/loss of associate (23,427) (27,407) 85<br />
Income tax 7,200 8,286 87<br />
Net profit or loss for the year ** (44,223) (77,004) 57<br />
* <strong>The</strong> share of profits of associates is not included. Commission income is shown in a separate line.<br />
** Includes the portion of net profit for the financial year attributed to minority owners.<br />
Highlights from the balance sheet<br />
BALANCE SHEET (in EUR thous<strong>and</strong>) 31.12.2009<br />
31.12.2008<br />
adjusted<br />
Index<br />
31.12.2009 /<br />
31.12.2008<br />
Assets 847,785 795,464 107<br />
Intangible <strong>and</strong> tangible fixed assets 106,451 104,532 102<br />
Investment property 29,814 28,708 104<br />
Financial assets <strong>and</strong> investments 374,256 393,268 95<br />
Receivables, inventories <strong>and</strong> other 131,048 141,681 92<br />
Unit-linked investments of policyholders <strong>and</strong> reinsurance contracts 165,486 95,970 172<br />
Cash <strong>and</strong> cash equivalents 40,730 31,305 130<br />
Equity <strong>and</strong> liabilities 847,785 795,464 107<br />
Equity * 151,605 192,247 79<br />
Liabilities arising from insurance contracts 296,098 279,766 106<br />
Unit-linked liabilities to policyholders 140,109 79,309 177<br />
Investment contracts 17,703 16,394 108<br />
Financial liabilities 196,132 181,909 108<br />
Operating <strong>and</strong> other liabilities 46,137 45,838 101<br />
* Also includes minority interest.<br />
34