The Group KD Group and KD Group dd
The Group KD Group and KD Group dd
The Group KD Group and KD Group dd

Create successful ePaper yourself
Turn your PDF publications into a flip-book with our unique Google optimized e-Paper software.
<strong>The</strong> <strong>KD</strong> <strong>Group</strong> Annual Report 2009<br />
Operating expenses<br />
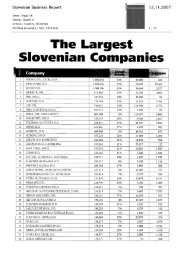
In 2009 operating expenses 19 totalled EUR 431.4 million, up 22 percent compared to 2008. In the operating expenses<br />
structure, the majority, 63 percent represents net expenditure for insurance entitlements <strong>and</strong> claims, which recorded a 73<br />
percent increase in 2009, primarily due to increase in liabilities to the unit-linked investments (stock prices growth in 2009<br />
compared to 2008) <strong>and</strong> thus the increase in long-term insurance provisions. Compared to the previous year, costs of<br />
services which account for 16 percent of total operating expenses, are down by 9 percent, as are labour costs which account<br />
for 13 percent of total costs <strong>and</strong> which recorded an 11 percent decline. This reduction is due to the disposal of<br />
cinematographic activities <strong>and</strong> rationalisation of the costs in the <strong>Group</strong>. Majority of other expenses present revaluation<br />
operating expenses due to impairment of receivables, loans <strong>and</strong> goodwill.<br />
Structure of operating expenses <strong>and</strong> changes in 2009 <strong>and</strong> 2008 (in EUR thous<strong>and</strong>):<br />
2009 2008<br />
Operating expenses ( in EUR thous<strong>and</strong> )<br />
0<br />
(50.000)<br />
(100.000)<br />
(150.000)<br />
(200.000)<br />
(250.000)<br />
(300.000)<br />
(350.000)<br />
(400.000)<br />
(450.000)<br />
(500.000)<br />
(68.690) (75.690)<br />
(57.577) (64.406)<br />
(156.842)<br />
(271.476)<br />
(57.274)<br />
(33.657)<br />
(431.399)<br />
(354.212)<br />
Other expenses<br />
Net expenses for<br />
claims<br />
Labour costs<br />
Cost of services<br />
Net profit or loss<br />
<strong>The</strong> <strong>Group</strong> recorded a net loss in the amount of EUR 44.2 million in 2009.<br />
<strong>The</strong> tightened financing conditions resulted in the impairment <strong>and</strong> write-down of some of financial investments. Profits were<br />
generated in 2009 by the health insurance (EUR 3.8 million) <strong>and</strong> property insurance (EUR 2.2 million). <strong>The</strong> largest loss was<br />
recorded by financial services (EUR 35 million), followed by life insurance (EUR 10.4 million) <strong>and</strong> banking sector which<br />
incurred a loss of EUR 3.4 million.<br />
Net profit or loss of the <strong>Group</strong> in 2009 <strong>and</strong> 2008 (in EUR thous<strong>and</strong>):<br />
0<br />
2009 2008<br />
Net profit or loss ( in EUR thous<strong>and</strong>)<br />
(10.000)<br />
(20.000)<br />
(30.000)<br />
(40.000)<br />
(50.000)<br />
(60.000)<br />
(70.000)<br />
(80.000)<br />
(90.000)<br />
(44.223)<br />
(77.004)<br />
19 Expenses <strong>and</strong> costs are shown with a negative sign so that the tables in the analysis of operations are in line with the tables in the financial section of the<br />
Annual Report.<br />
37