The Group KD Group and KD Group dd
The Group KD Group and KD Group dd
The Group KD Group and KD Group dd

You also want an ePaper? Increase the reach of your titles
YUMPU automatically turns print PDFs into web optimized ePapers that Google loves.
<strong>The</strong> <strong>KD</strong> <strong>Group</strong> Annual Report 2009<br />
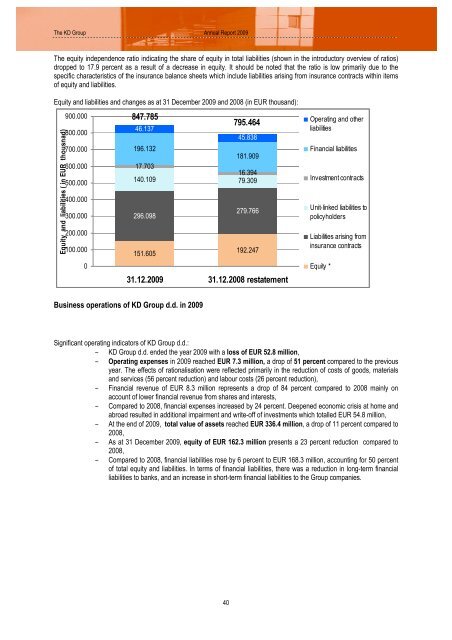
<strong>The</strong> equity independence ratio indicating the share of equity in total liabilities (shown in the introductory overview of ratios)<br />
dropped to 17.9 percent as a result of a decrease in equity. It should be noted that the ratio is low primarily due to the<br />
specific characteristics of the insurance balance sheets which include liabilities arising from insurance contracts within items<br />
of equity <strong>and</strong> liabilities.<br />
Equity <strong>and</strong> liabilities <strong>and</strong> changes as at 31 December 2009 <strong>and</strong> 2008 (in EUR thous<strong>and</strong>):<br />
Equity <strong>and</strong> liabilities ( in EUR thousnad)<br />
900.000<br />
800.000<br />
700.000<br />
600.000<br />
500.000<br />
400.000<br />
300.000<br />
200.000<br />
100.000<br />
0<br />
847.785<br />
46.137<br />
795.464<br />
45.838<br />
196.132<br />
181.909<br />
17.703<br />
16.394<br />
140.109 79.309<br />
279.766<br />
296.098<br />
151.605<br />
192.247<br />
31.12.2009 31.12.2008 restatement<br />
Operating <strong>and</strong> other<br />
liabilities<br />
Financial liabilities<br />
Investment contracts<br />
Unit-linked liabilities to<br />
policyholders<br />
Liabilities arising from<br />
insurance contracts<br />
Equity *<br />
Business operations of <strong>KD</strong> <strong>Group</strong> d.d. in 2009<br />
Significant operating indicators of <strong>KD</strong> <strong>Group</strong> d.d.:<br />
– <strong>KD</strong> <strong>Group</strong> d.d. ended the year 2009 with a loss of EUR 52.8 million,<br />
– Operating expenses in 2009 reached EUR 7.3 million, a drop of 51 percent compared to the previous<br />
year. <strong>The</strong> effects of rationalisation were reflected primarily in the reduction of costs of goods, materials<br />
<strong>and</strong> services (56 percent reduction) <strong>and</strong> labour costs (26 percent reduction),<br />
– Financial revenue of EUR 8.3 million represents a drop of 84 percent compared to 2008 mainly on<br />
account of lower financial revenue from shares <strong>and</strong> interests,<br />
– Compared to 2008, financial expenses increased by 24 percent. Deepened economic crisis at home <strong>and</strong><br />
abroad resulted in a<strong>dd</strong>itional impairment <strong>and</strong> write-off of investments which totalled EUR 54.8 million,<br />
– At the end of 2009, total value of assets reached EUR 336.4 million, a drop of 11 percent compared to<br />
2008,<br />
– As at 31 December 2009, equity of EUR 162.3 million presents a 23 percent reduction compared to<br />
2008,<br />
– Compared to 2008, financial liabilities rose by 6 percent to EUR 168.3 million, accounting for 50 percent<br />
of total equity <strong>and</strong> liabilities. In terms of financial liabilities, there was a reduction in long-term financial<br />
liabilities to banks, <strong>and</strong> an increase in short-term financial liabilities to the <strong>Group</strong> companies.<br />
40