Synthesis Report - European Commission - Europa
Synthesis Report - European Commission - Europa
Synthesis Report - European Commission - Europa

Create successful ePaper yourself
Turn your PDF publications into a flip-book with our unique Google optimized e-Paper software.
Ex-post Evaluation of the ERDF 2000-2006<br />
<strong>Synthesis</strong> <strong>Report</strong><br />
75% of the average, qualified for ‘phasing out’ support –i.e. they received less, but still some aid<br />
in order to enable them to adjust to life without the funding 8 .<br />
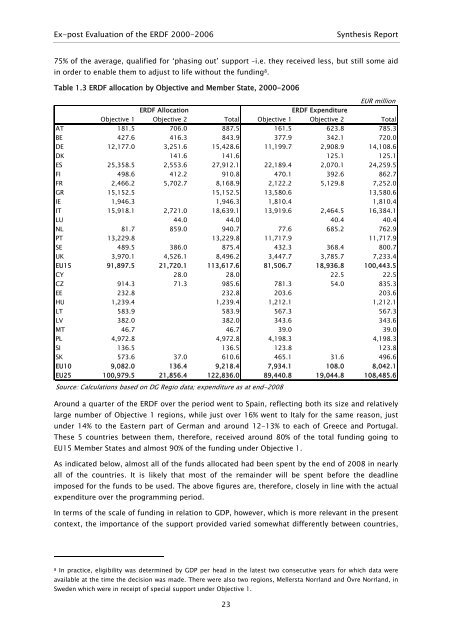
Table 1.3 ERDF allocation by Objective and Member State, 2000-2006<br />
EUR million<br />
ERDF Allocation<br />
ERDF Expenditure<br />
Objective 1 Objective 2 Total Objective 1 Objective 2 Total<br />
AT 181.5 706.0 887.5 161.5 623.8 785.3<br />
BE 427.6 416.3 843.9 377.9 342.1 720.0<br />
DE 12,177.0 3,251.6 15,428.6 11,199.7 2,908.9 14,108.6<br />
DK 141.6 141.6 125.1 125.1<br />
ES 25,358.5 2,553.6 27,912.1 22,189.4 2,070.1 24,259.5<br />
FI 498.6 412.2 910.8 470.1 392.6 862.7<br />
FR 2,466.2 5,702.7 8,168.9 2,122.2 5,129.8 7,252.0<br />
GR 15,152.5 15,152.5 13,580.6 13,580.6<br />
IE 1,946.3 1,946.3 1,810.4 1,810.4<br />
IT 15,918.1 2,721.0 18,639.1 13,919.6 2,464.5 16,384.1<br />
LU 44.0 44.0 40.4 40.4<br />
NL 81.7 859.0 940.7 77.6 685.2 762.9<br />
PT 13,229.8 13,229.8 11,717.9 11,717.9<br />
SE 489.5 386.0 875.4 432.3 368.4 800.7<br />
UK 3,970.1 4,526.1 8,496.2 3,447.7 3,785.7 7,233.4<br />
EU15 91,897.5 21,720.1 113,617.6 81,506.7 18,936.8 100,443.5<br />
CY 28.0 28.0 22.5 22.5<br />
CZ 914.3 71.3 985.6 781.3 54.0 835.3<br />
EE 232.8 232.8 203.6 203.6<br />
HU 1,239.4 1,239.4 1,212.1 1,212.1<br />
LT 583.9 583.9 567.3 567.3<br />
LV 382.0 382.0 343.6 343.6<br />
MT 46.7 46.7 39.0 39.0<br />
PL 4,972.8 4,972.8 4,198.3 4,198.3<br />
SI 136.5 136.5 123.8 123.8<br />
SK 573.6 37.0 610.6 465.1 31.6 496.6<br />
EU10 9,082.0 136.4 9,218.4 7,934.1 108.0 8,042.1<br />
EU25 100,979.5 21,856.4 122,836.0 89,440.8 19,044.8 108,485.6<br />
Source: Calculations based on DG Regio data; expenditure as at end-2008<br />
Around a quarter of the ERDF over the period went to Spain, reflecting both its size and relatively<br />
large number of Objective 1 regions, while just over 16% went to Italy for the same reason, just<br />
under 14% to the Eastern part of German and around 12-13% to each of Greece and Portugal.<br />
These 5 countries between them, therefore, received around 80% of the total funding going to<br />
EU15 Member States and almost 90% of the funding under Objective 1.<br />
As indicated below, almost all of the funds allocated had been spent by the end of 2008 in nearly<br />
all of the countries. It is likely that most of the remainder will be spent before the deadline<br />
imposed for the funds to be used. The above figures are, therefore, closely in line with the actual<br />
expenditure over the programming period.<br />
In terms of the scale of funding in relation to GDP, however, which is more relevant in the present<br />
context, the importance of the support provided varied somewhat differently between countries,<br />
8 In practice, eligibility was determined by GDP per head in the latest two consecutive years for which data were<br />
available at the time the decision was made. There were also two regions, Mellersta Norrland and Övre Norrland, in<br />
Sweden which were in receipt of special support under Objective 1.<br />
23